💜 Improvements Alert!
We’ve rolled out key improvements to threat insights and the Accounts tab in Event Explorer, and added a new risk signal called Session Sharing, to enhance how you detect and act on threats within your platform. These changes are designed to improve clarity and make it easier to identify and respond to unusual activity.
What’s Improved?
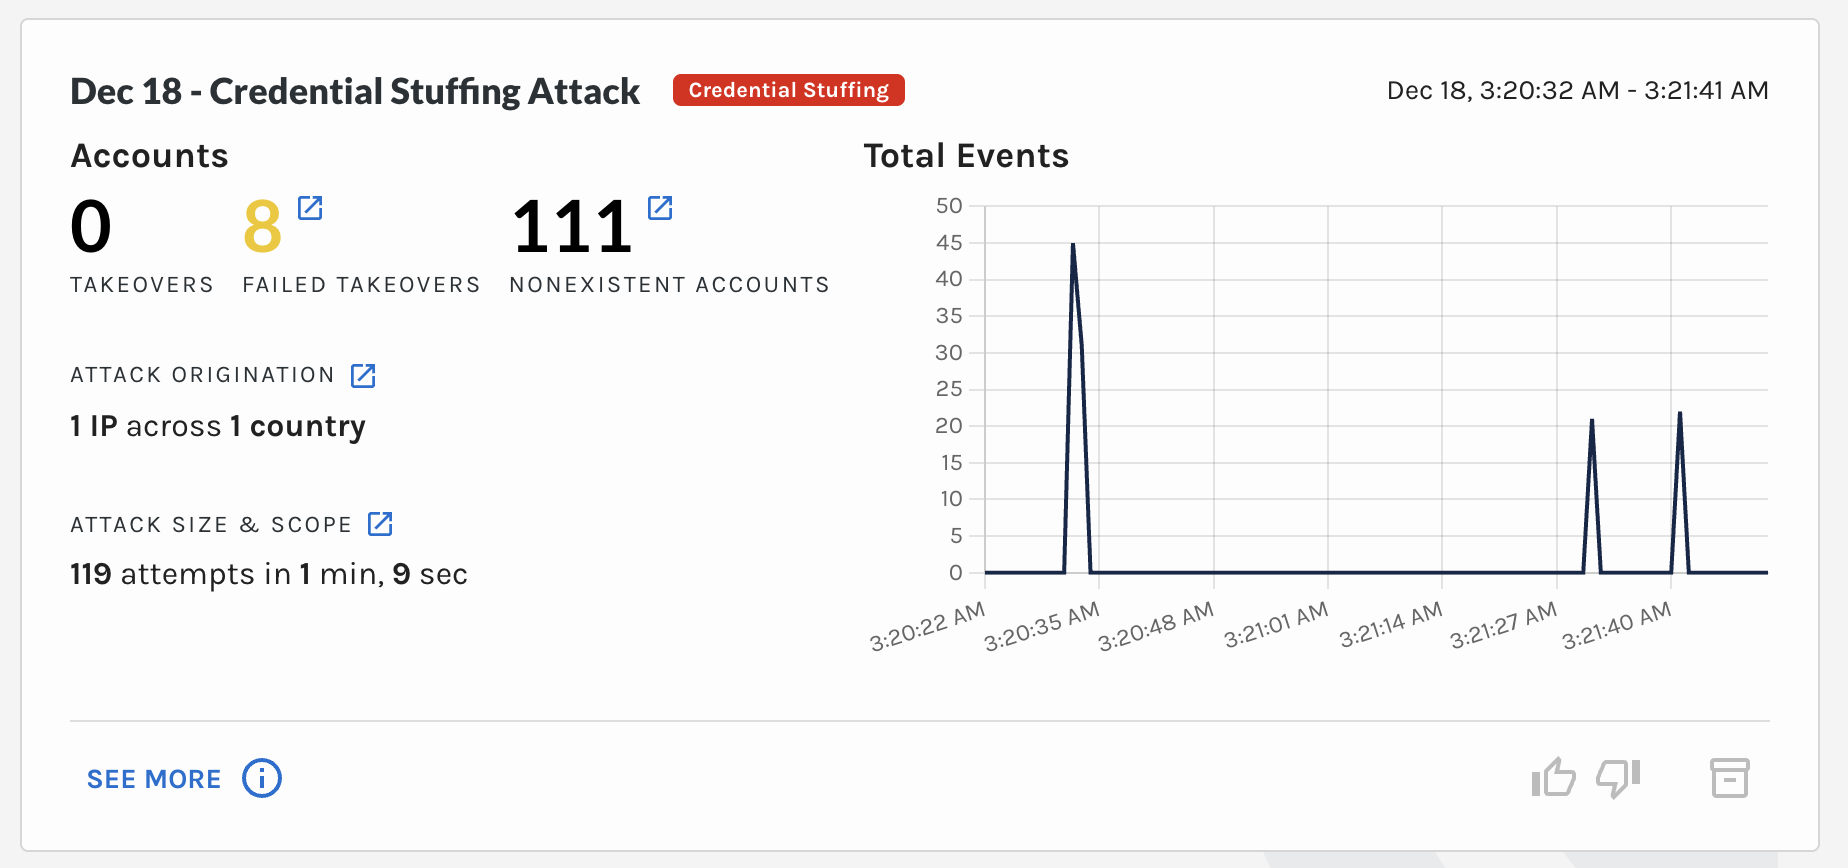
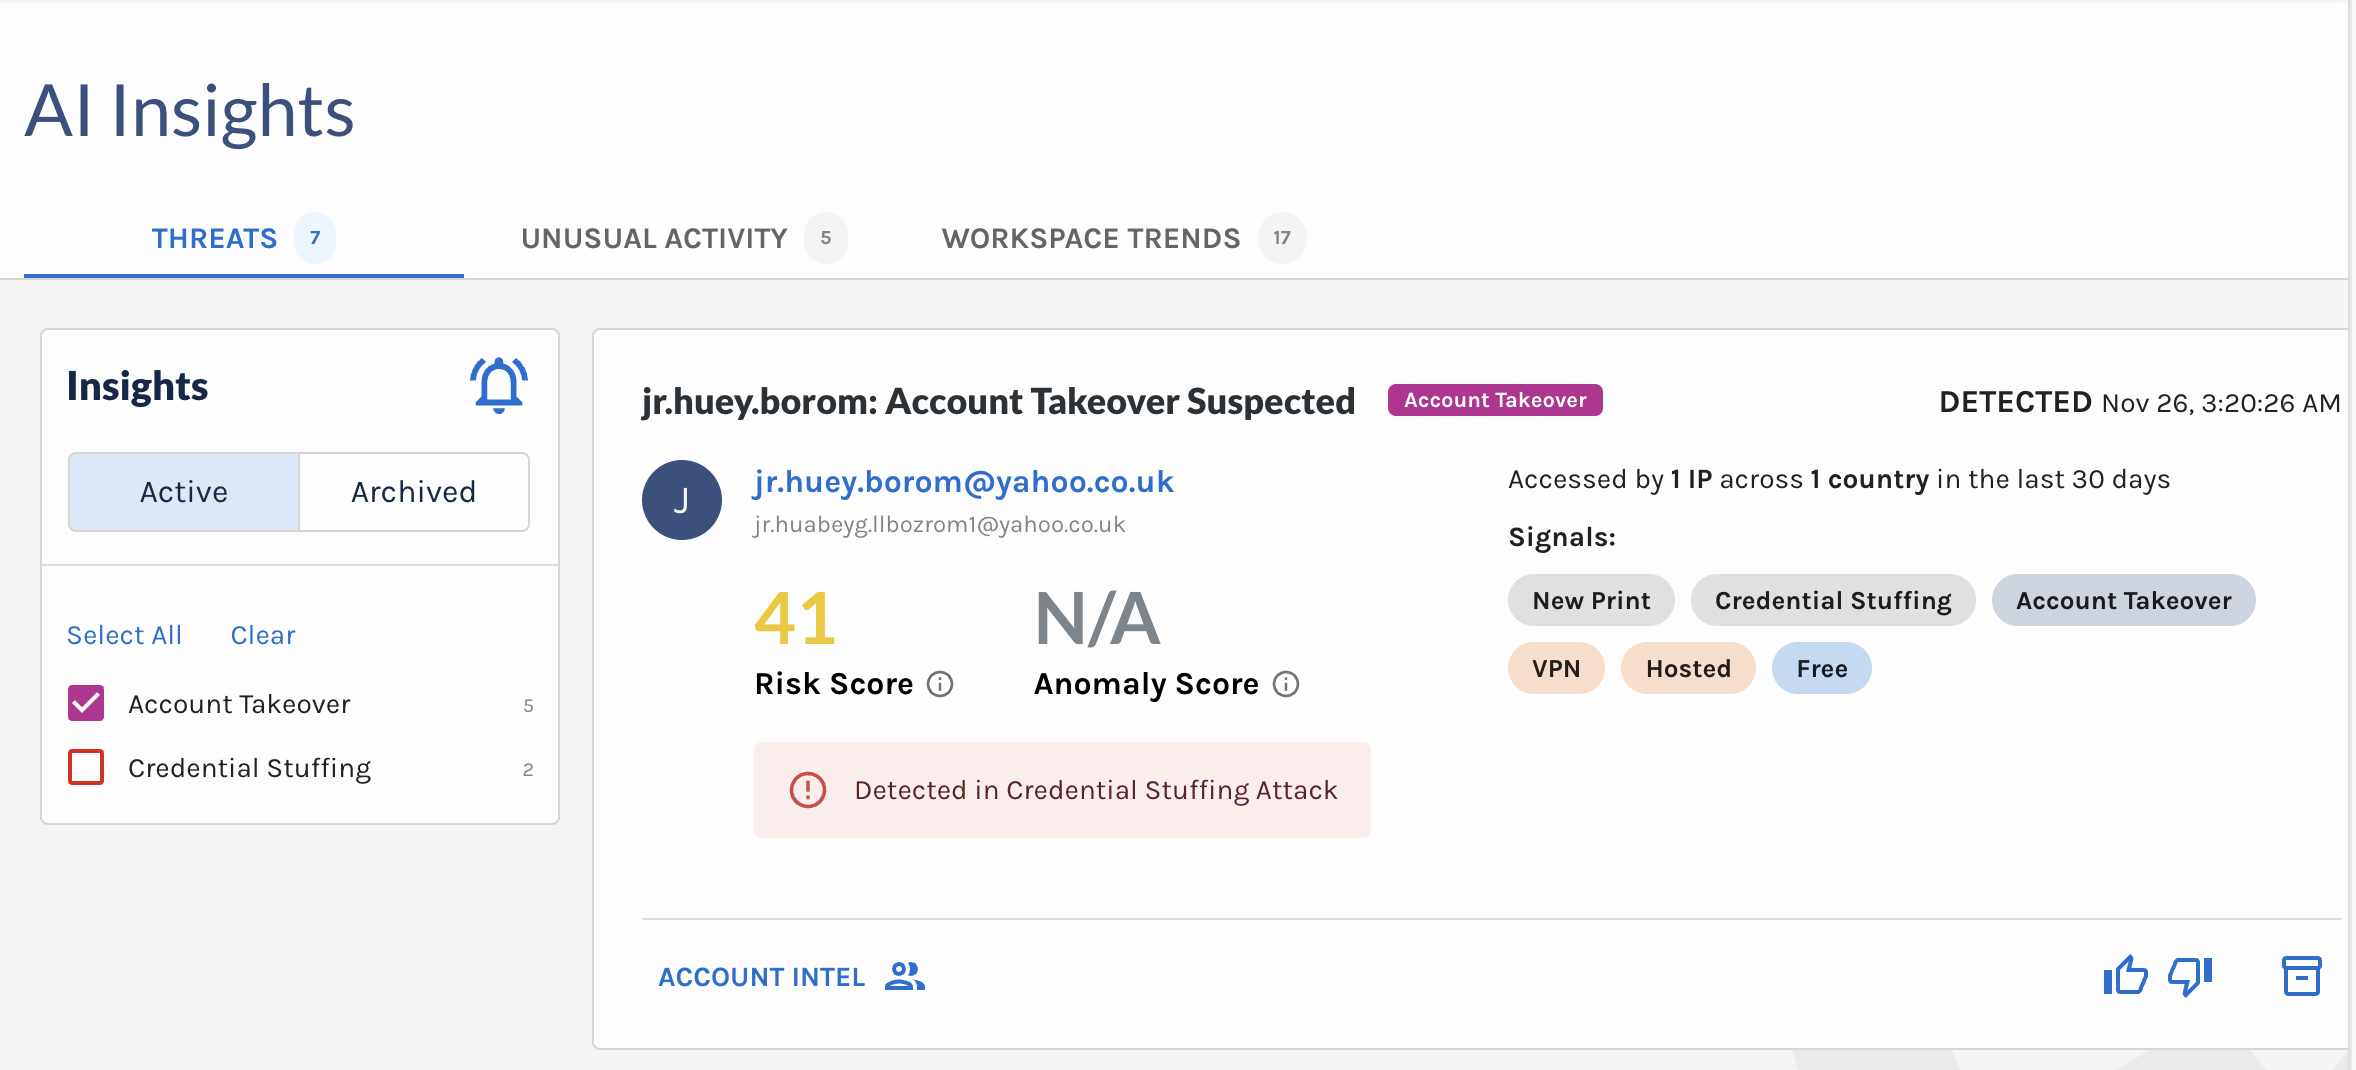
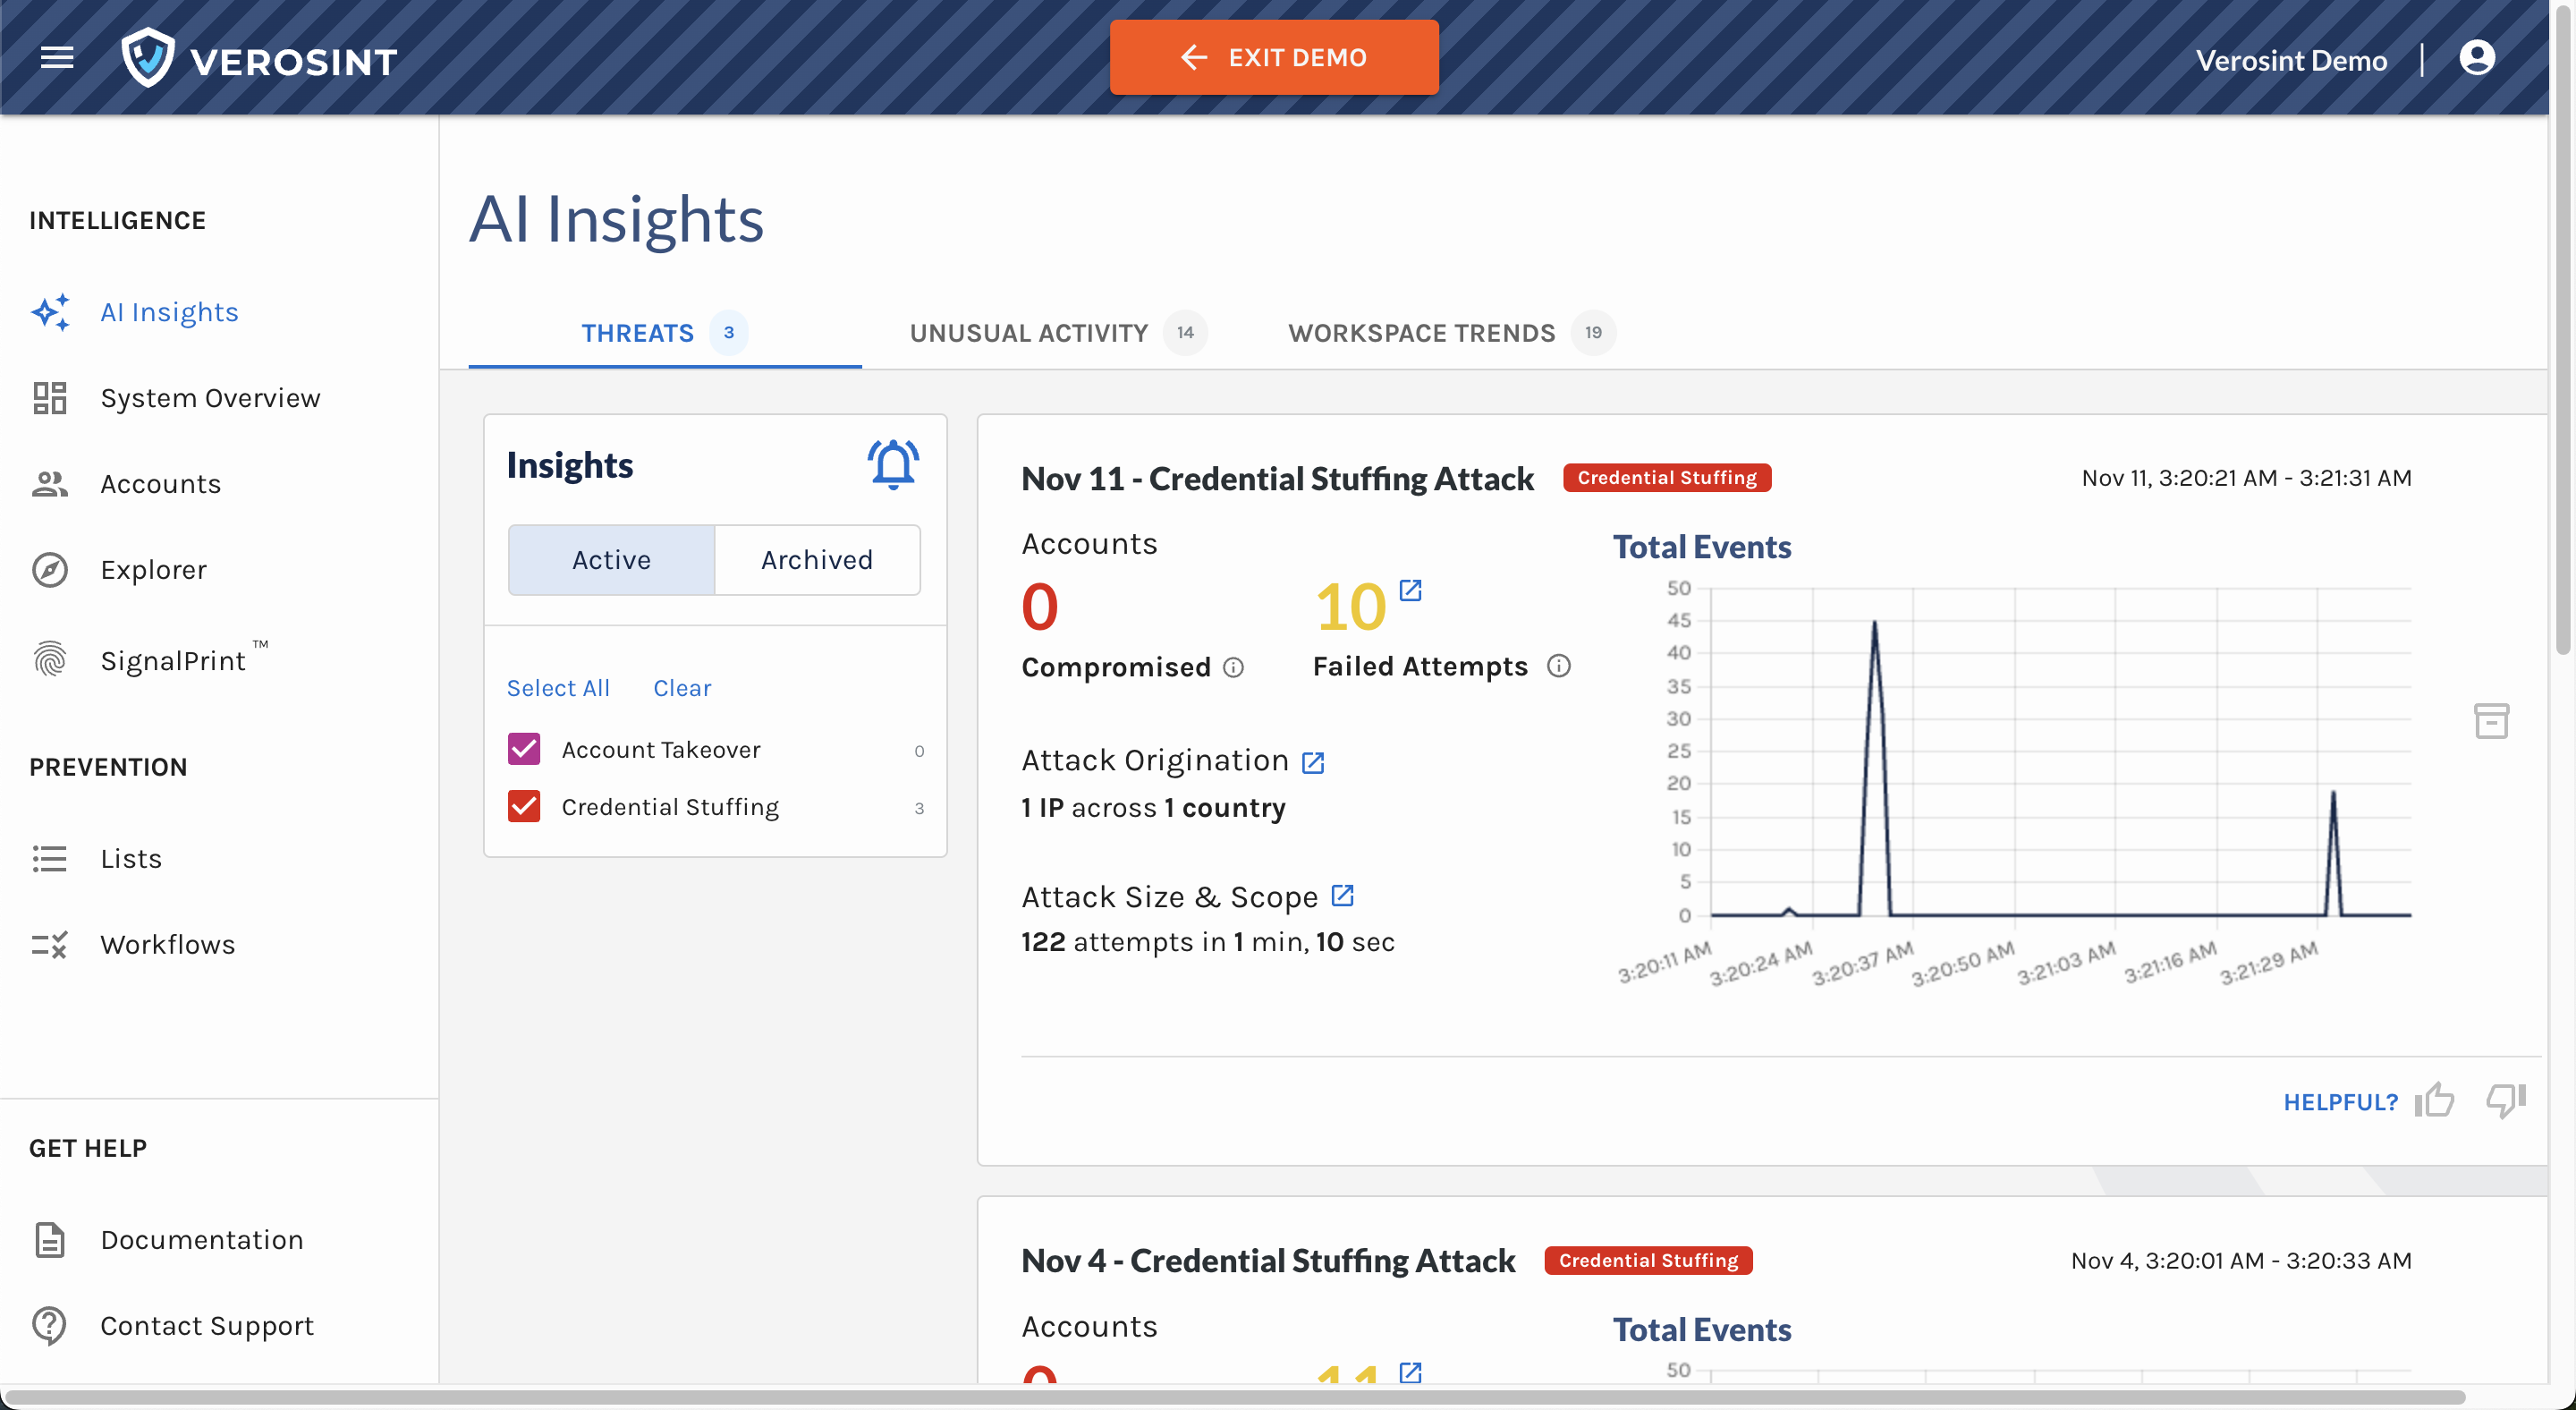
1️⃣ Credential Stuffing & Account Takeover Cards
- Enhanced readability: We redesigned these cards to make key details more accessible at a glance.
- Improved insights: If an account takeover (ATO) occurred during a credential stuffing attack, the Reason now includes specific details about the associated credential stuffing attack.

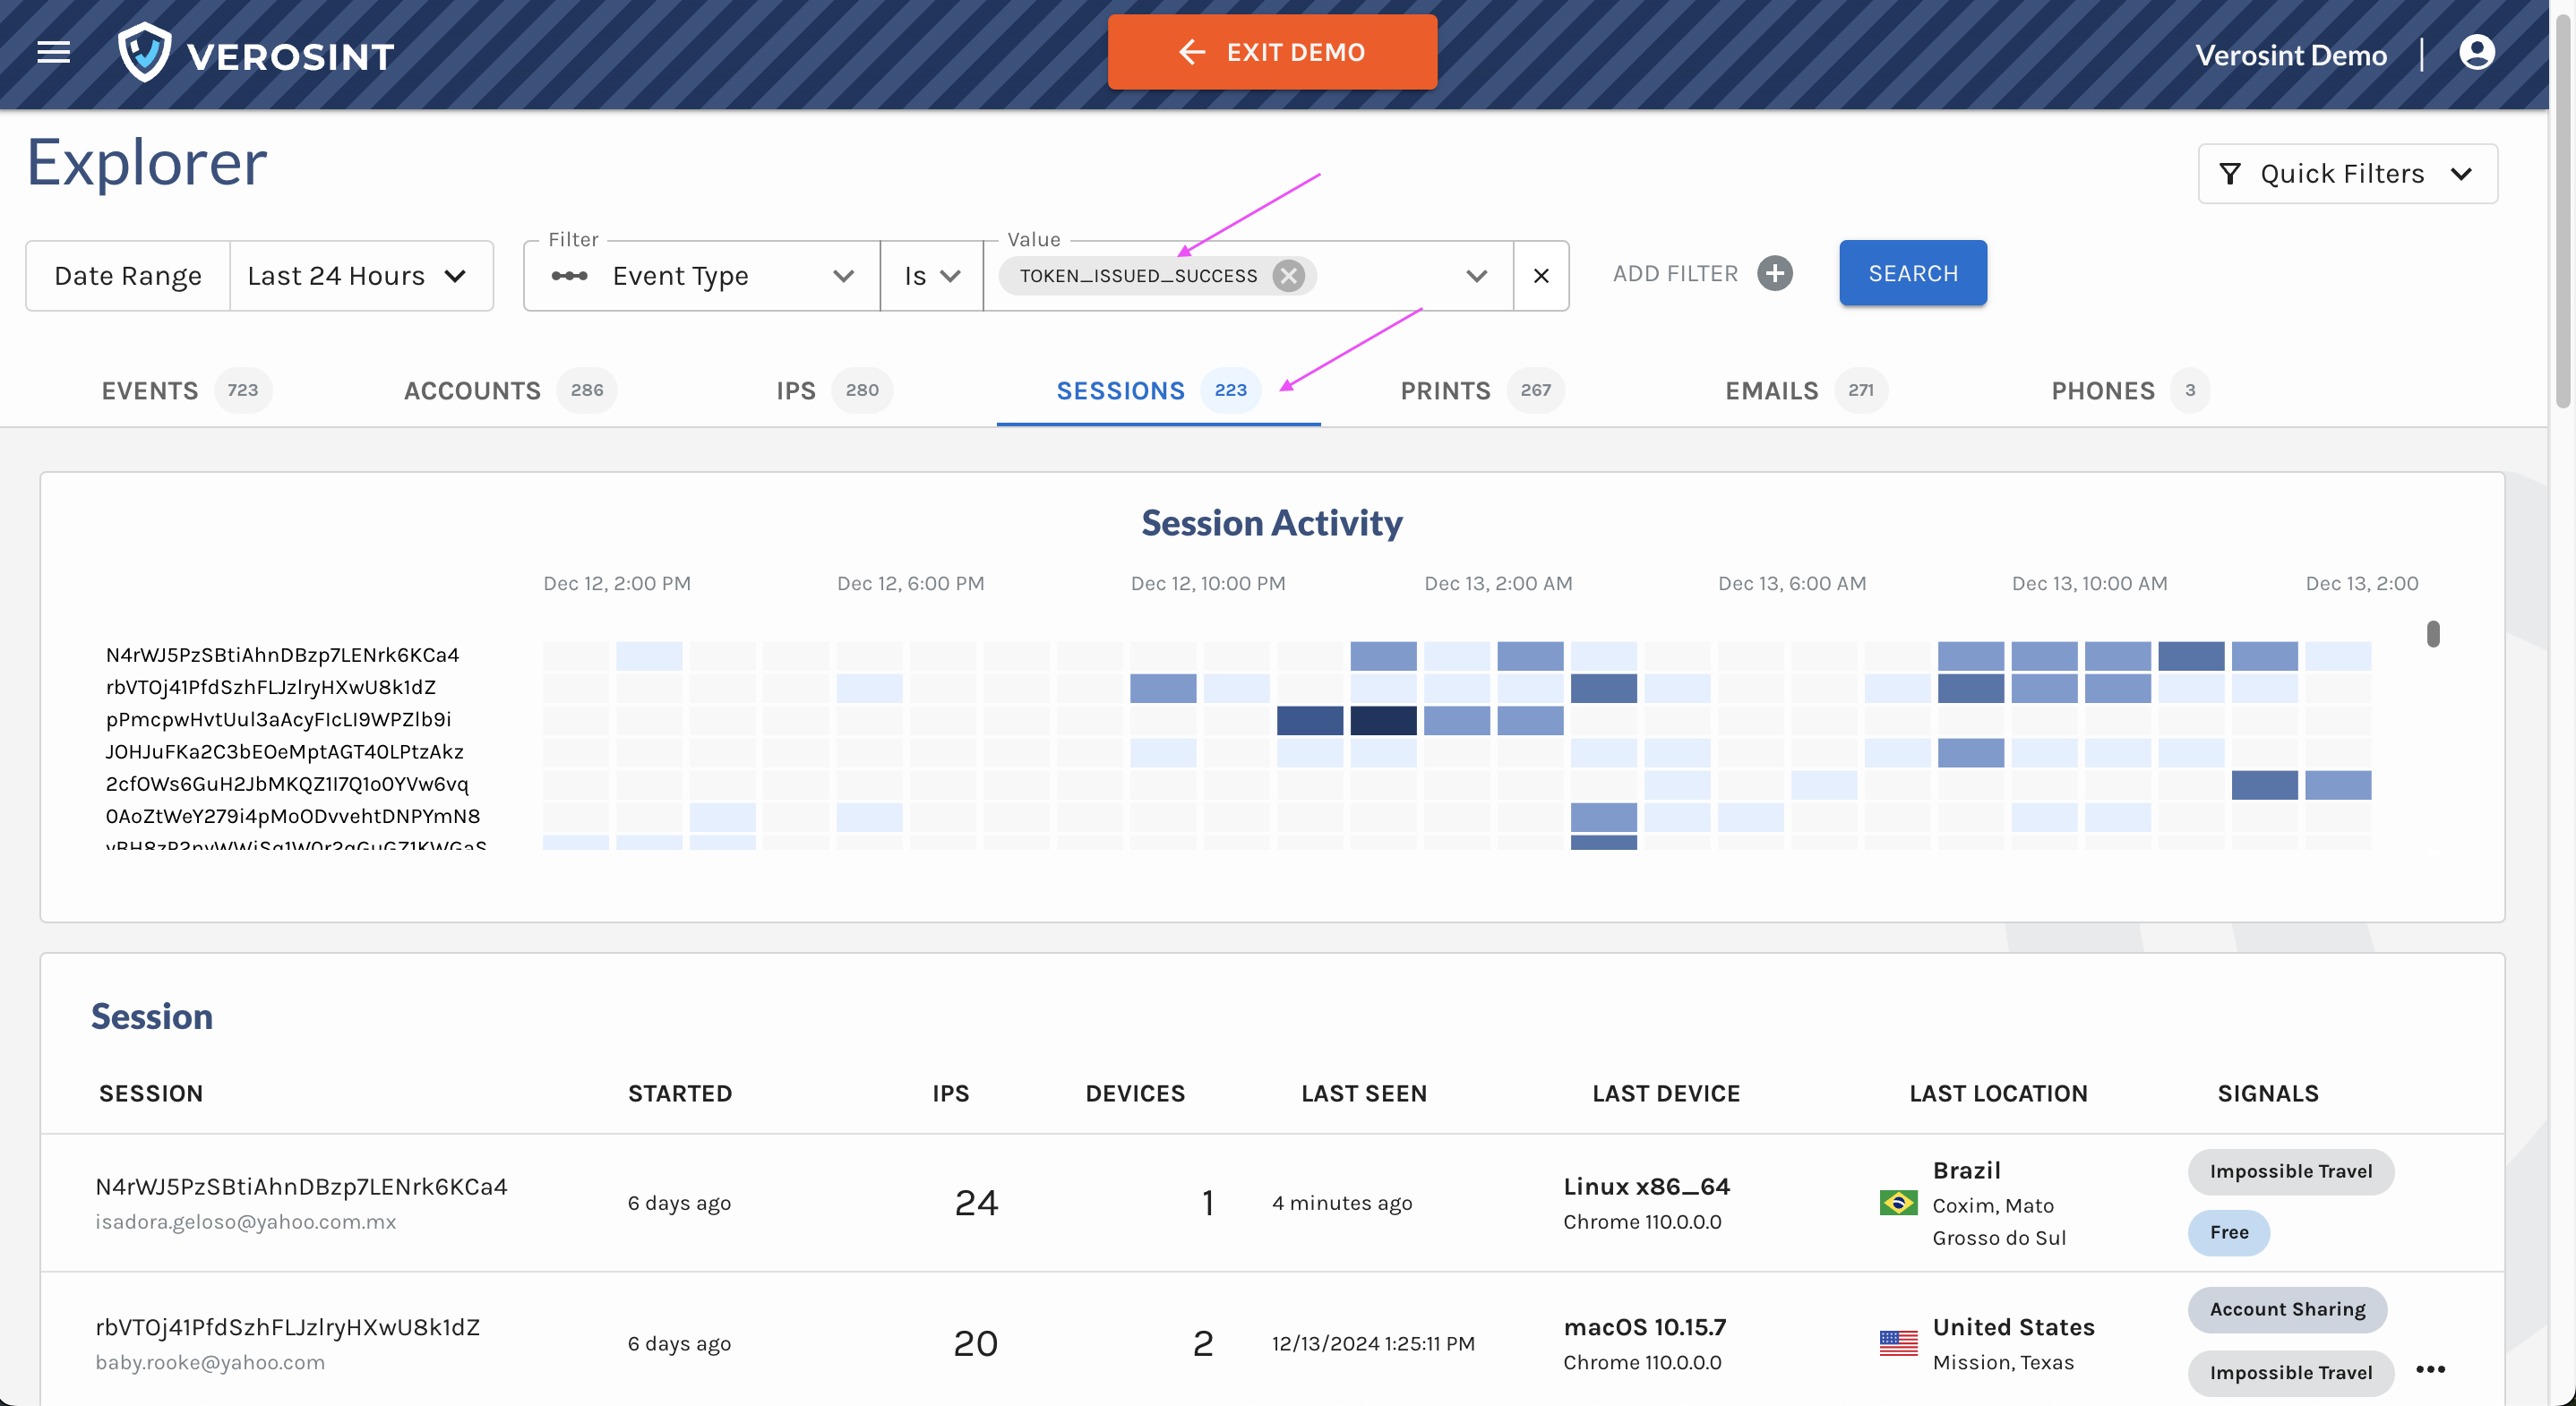
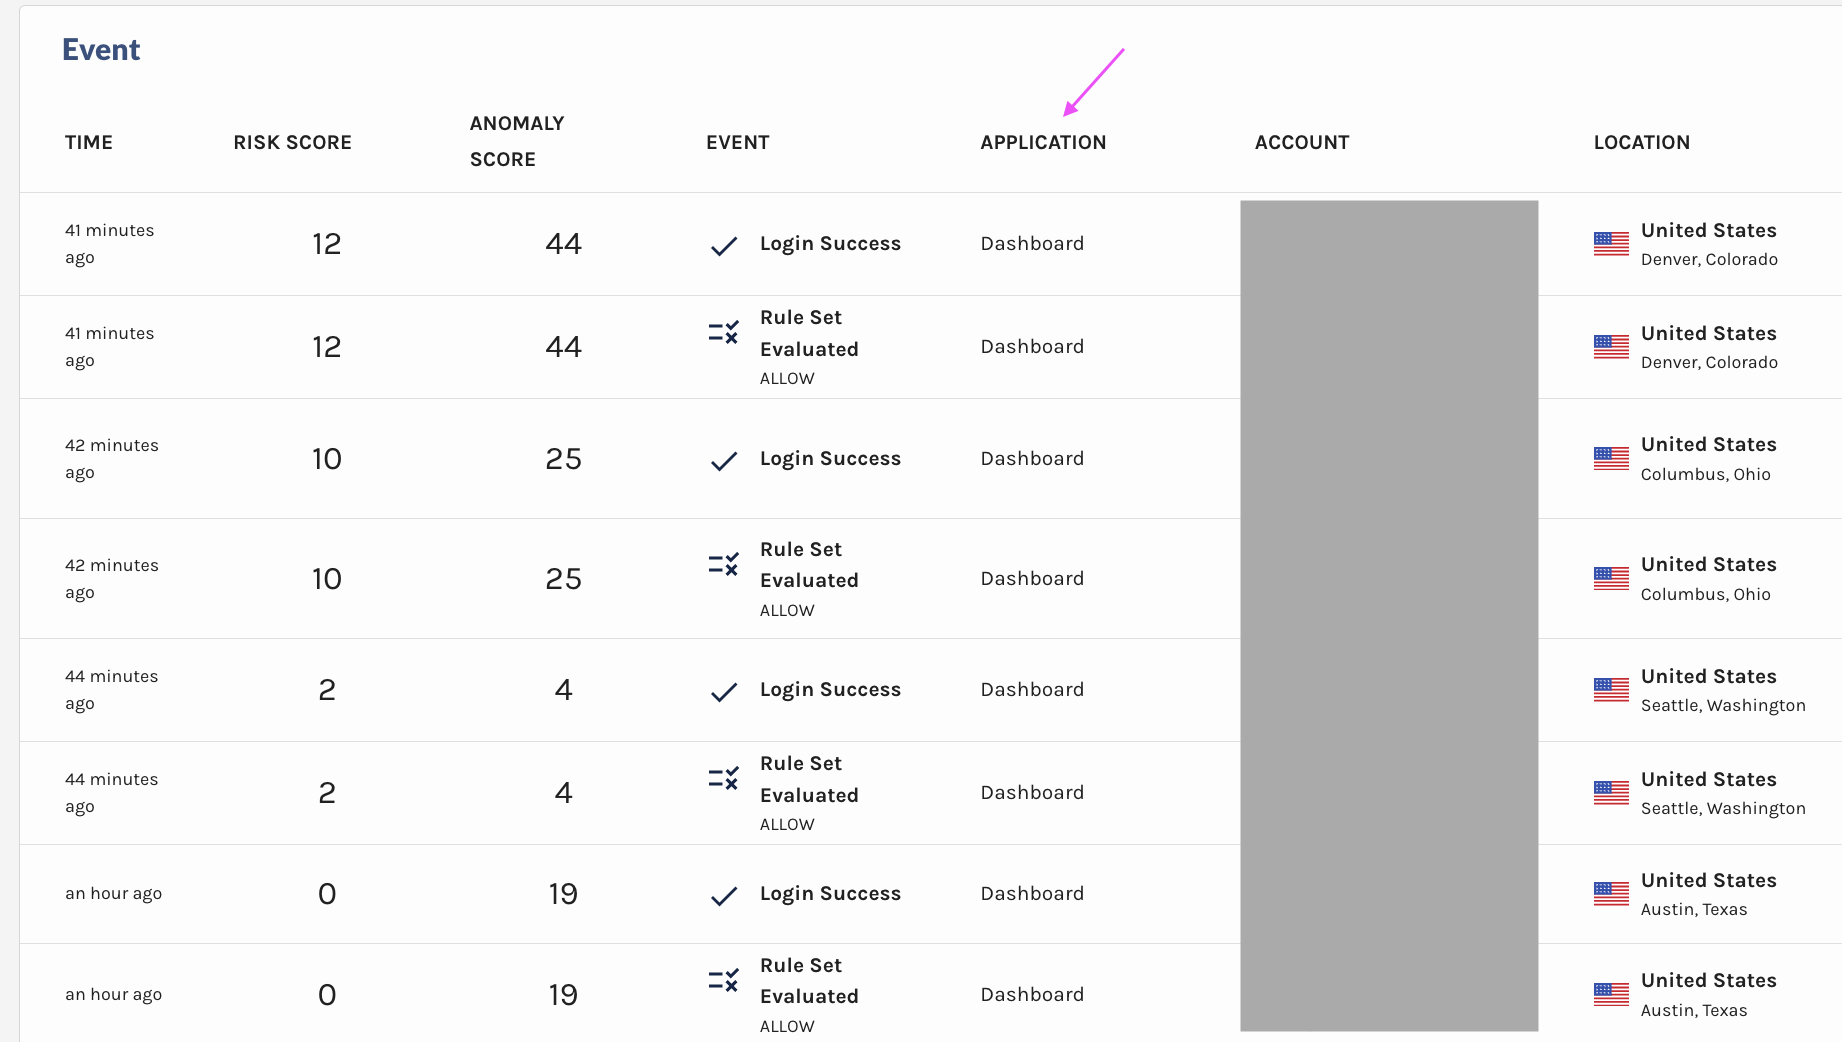
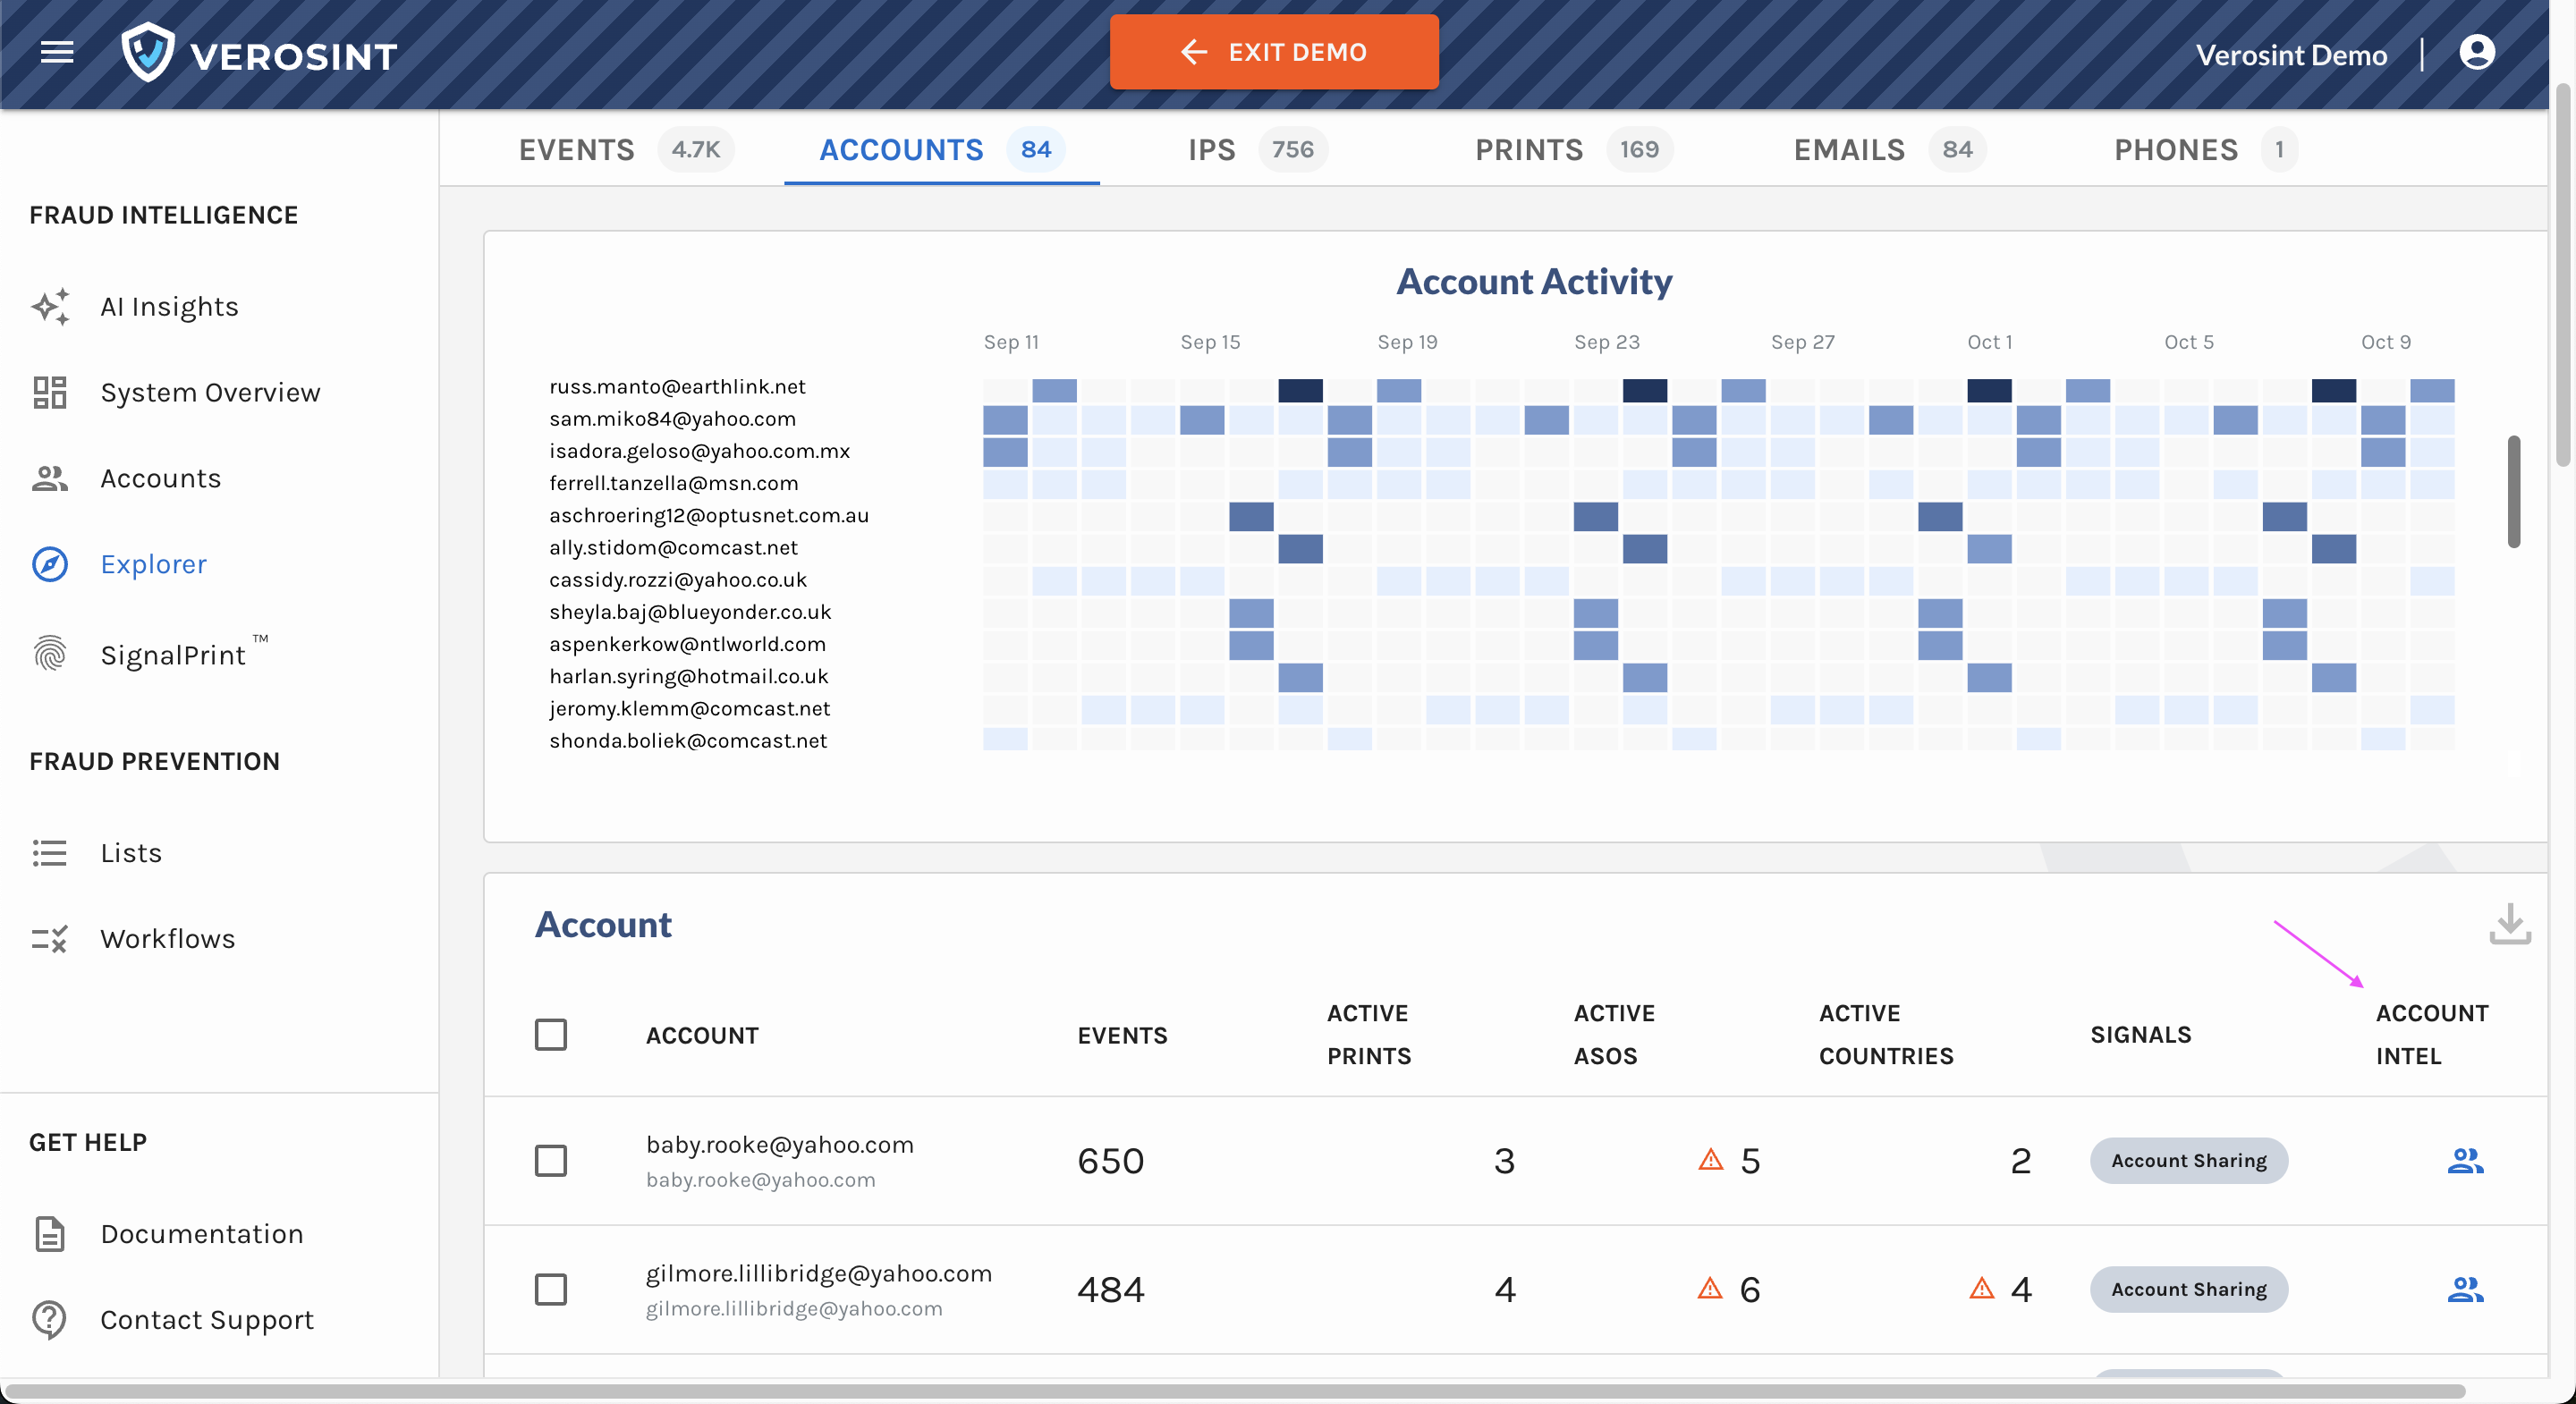
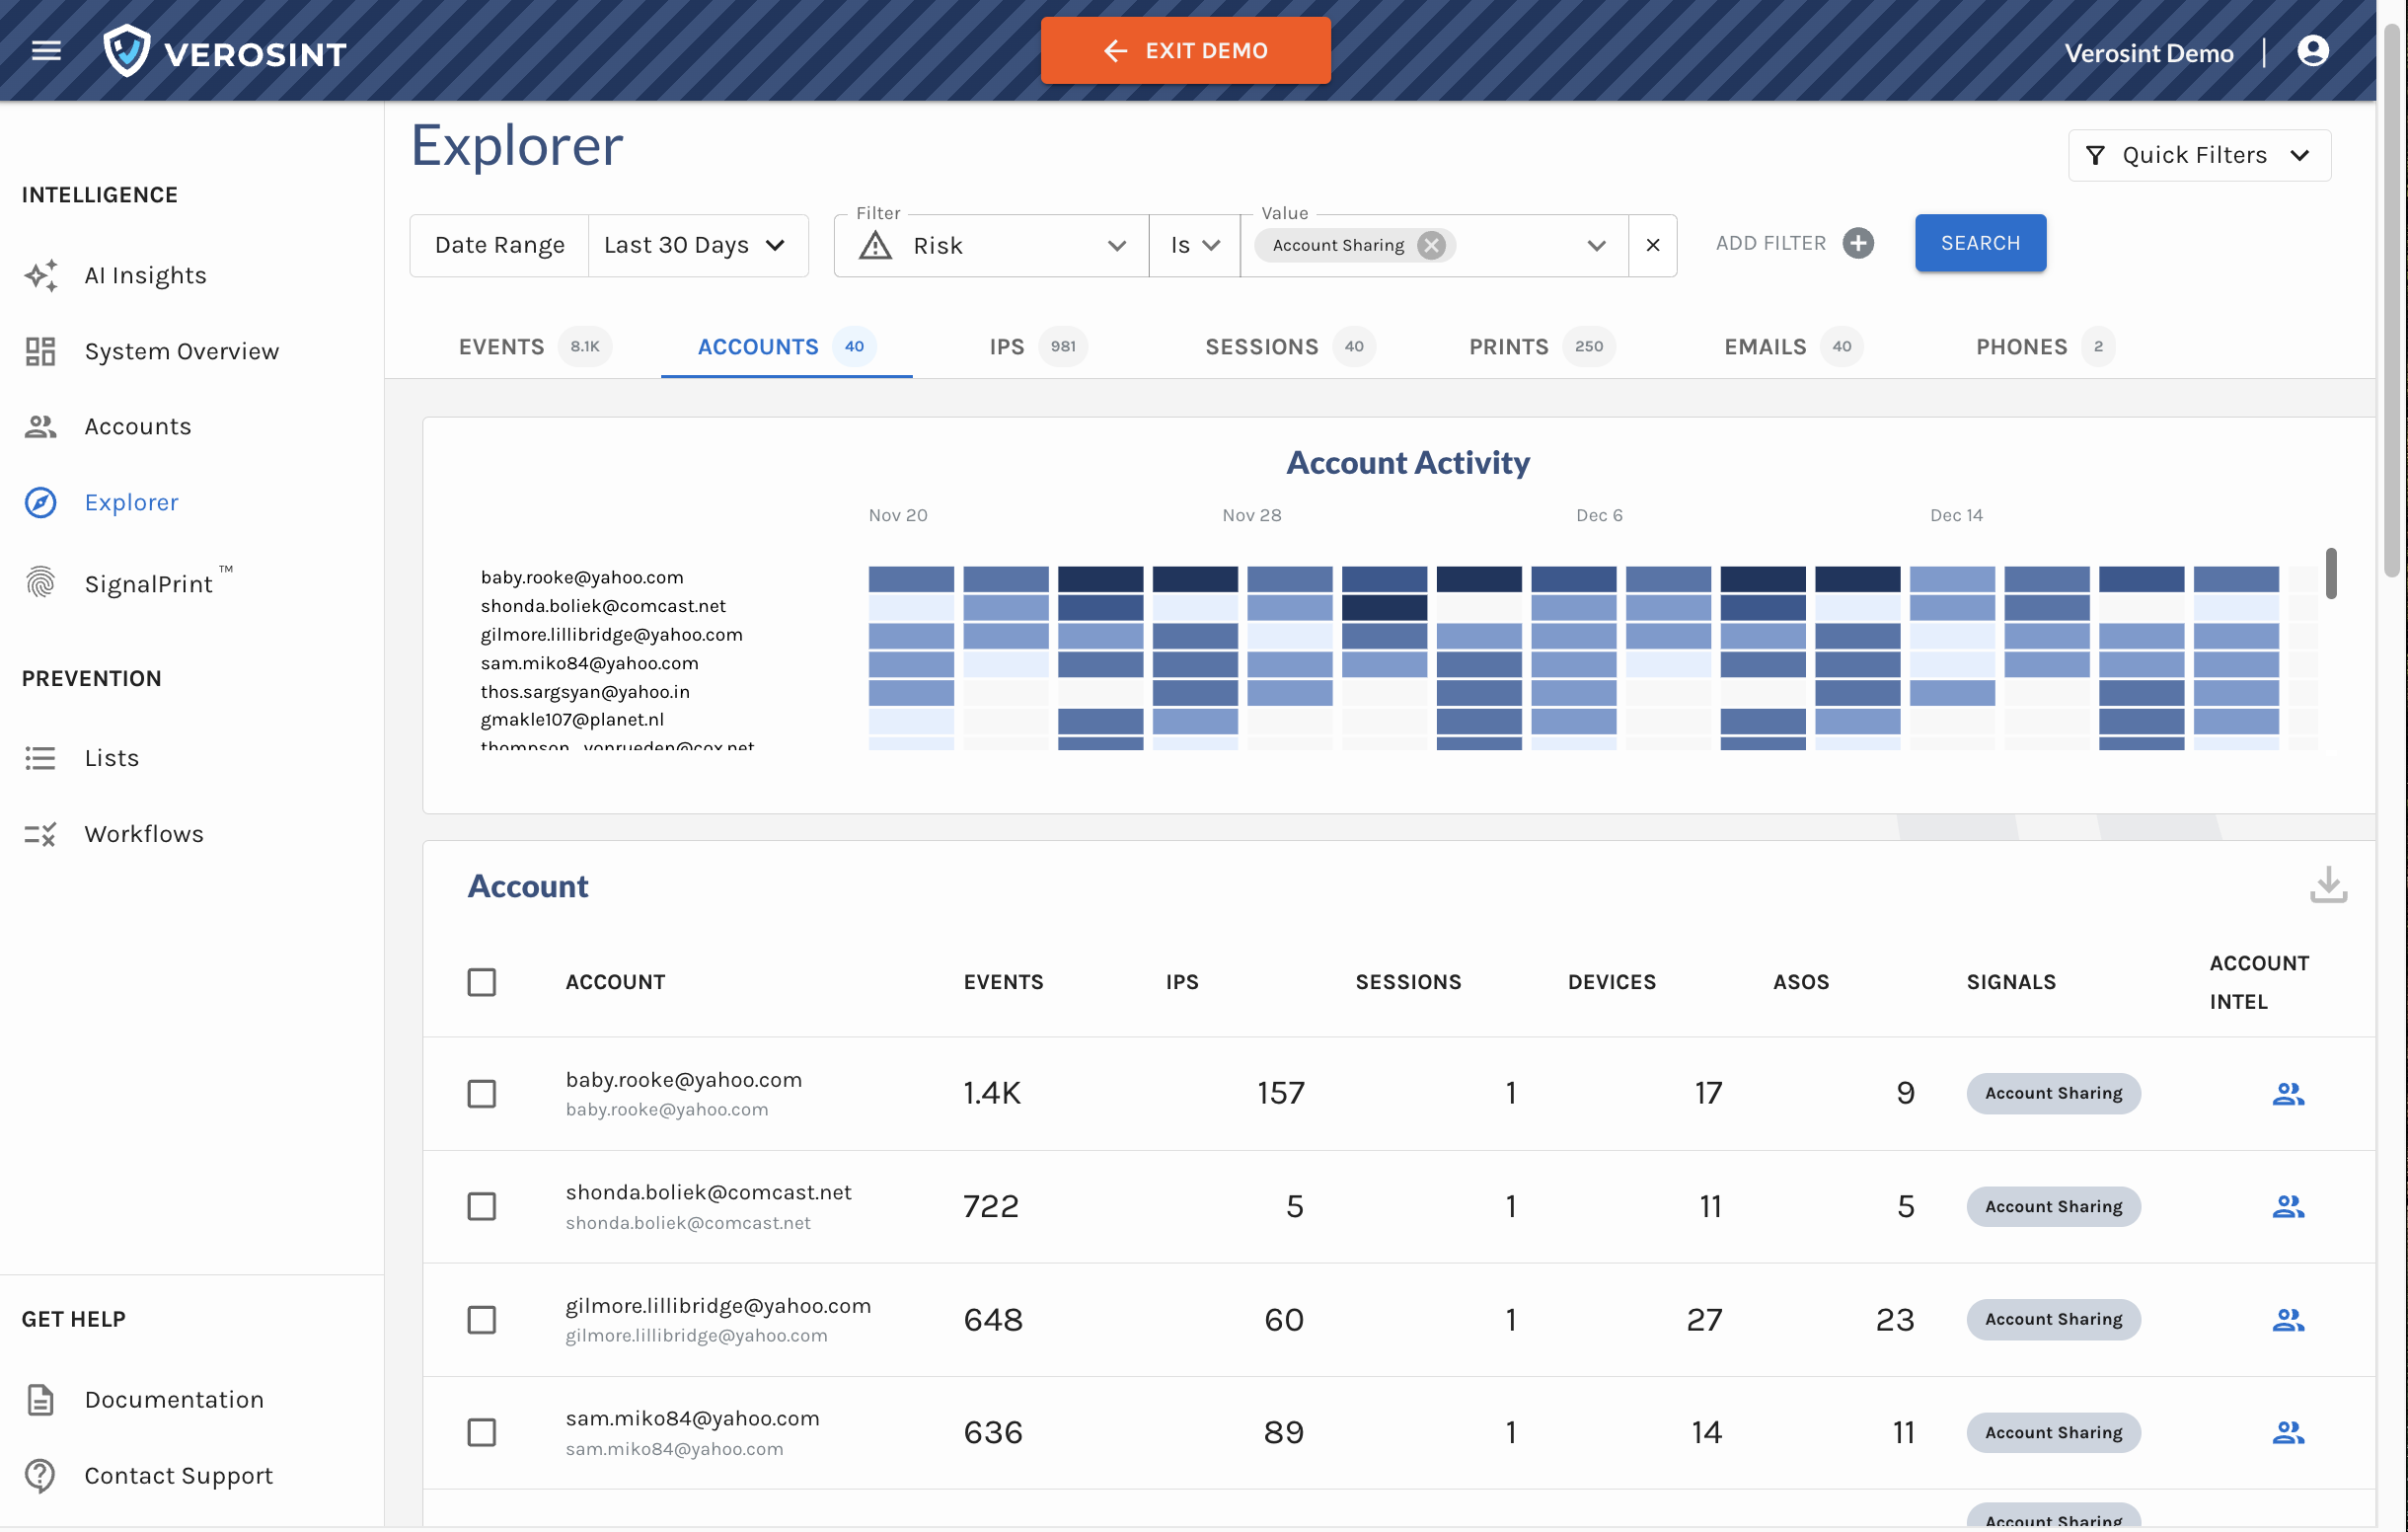
2️⃣ Accounts Table in Explorer
We’ve replaced some columns with session-related data to help you quickly identify suspicious activity and anomalies:
- IP Addresses: The total number of distinct IPs associated with an account. More than 2 is unusual.
- Sessions: The total number of distinct sessions associated with an account
- Devices: The total number of distinct devices used by the account. Multiple devices used consistently throughout the life of a session is highly unusual.
- ASOs: The total number of Autonomous System Organization that administers the IPs associated with an account. More than 2 is unusual.
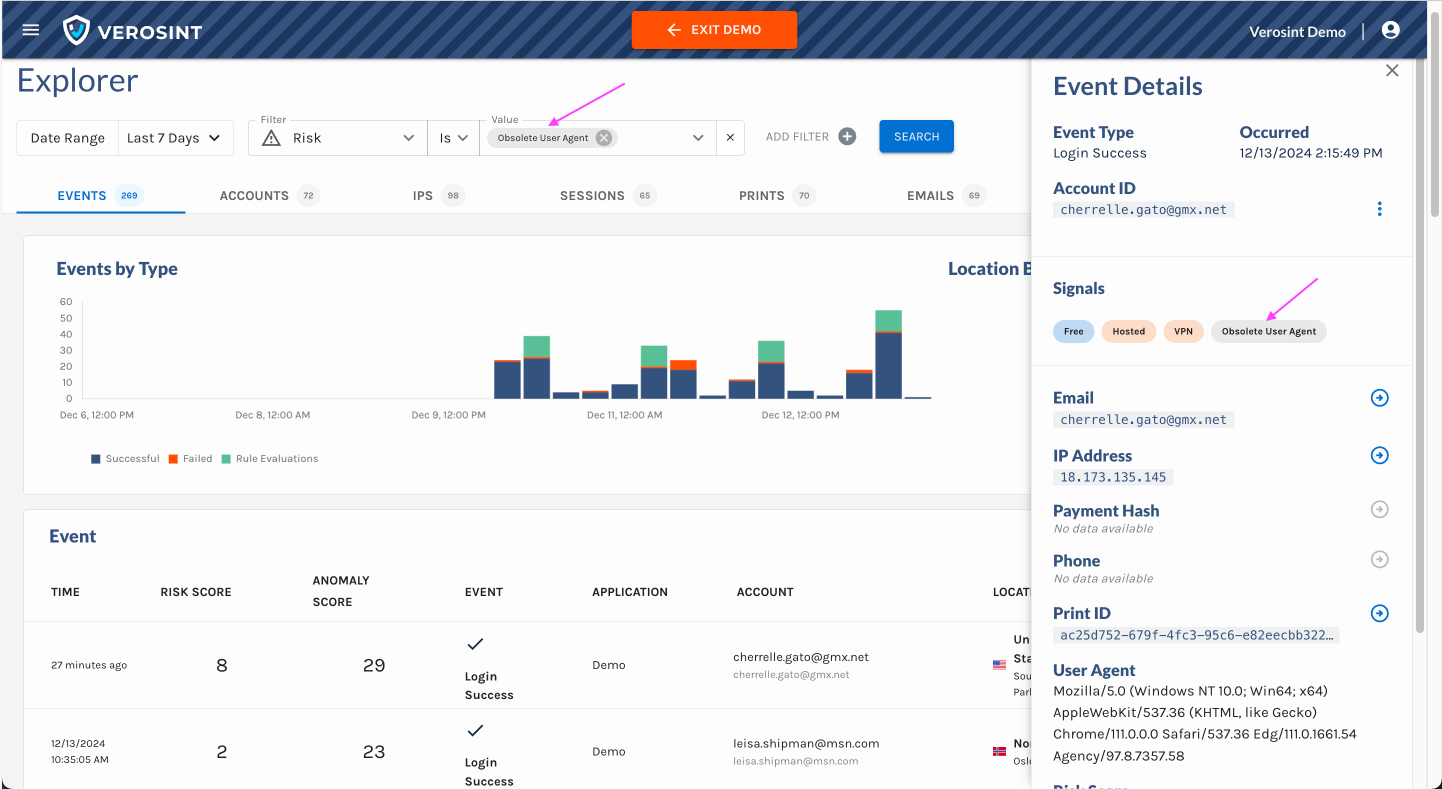
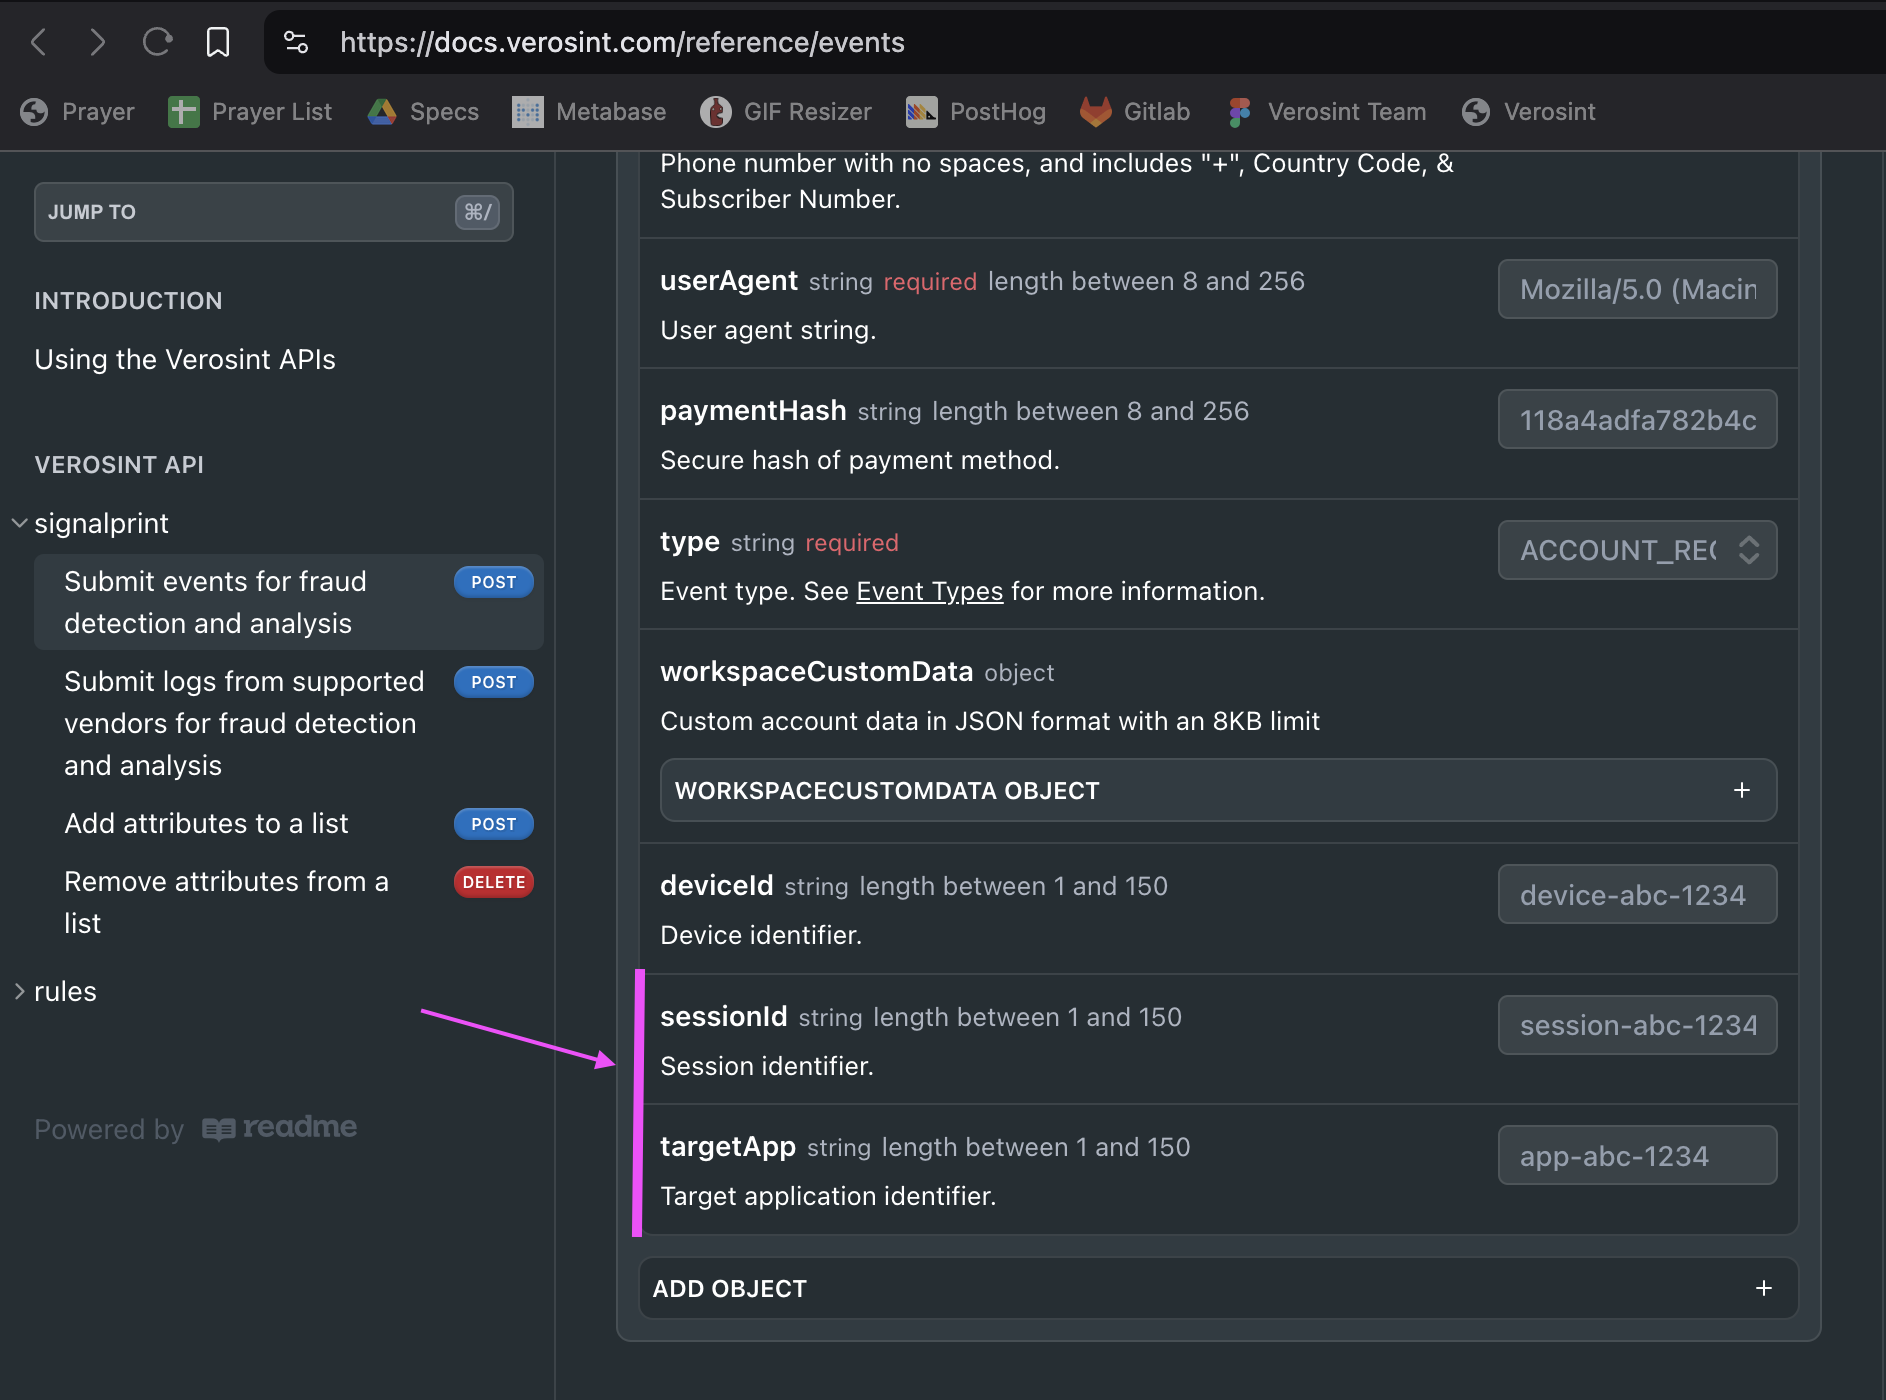
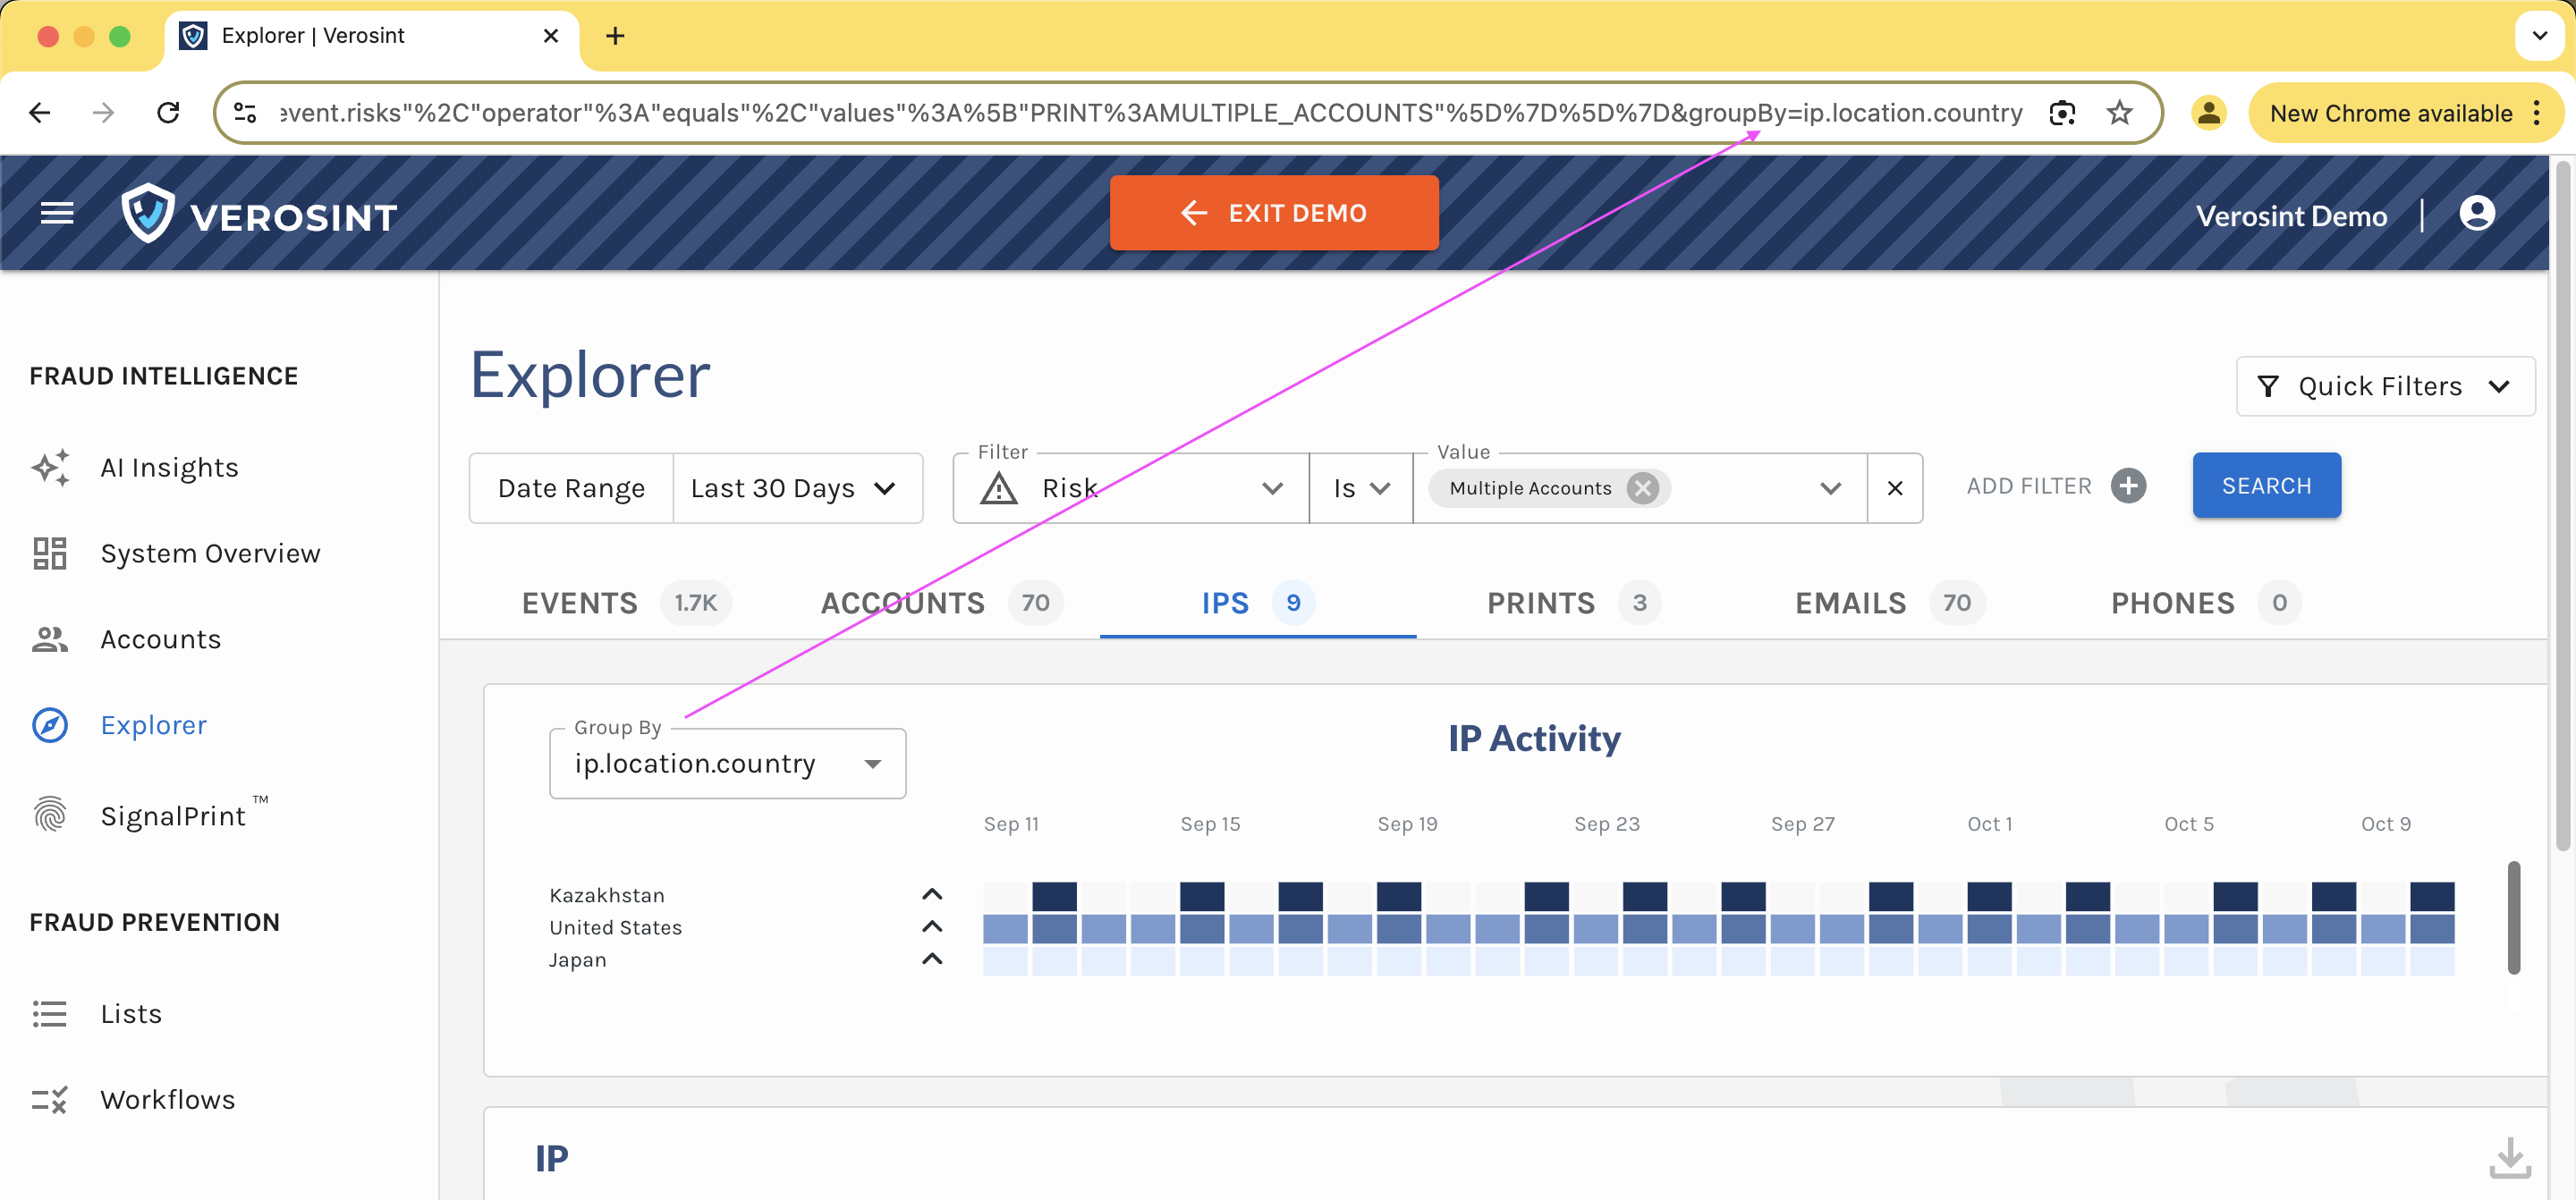
3️⃣ New Risk Signal Added: Session Sharing
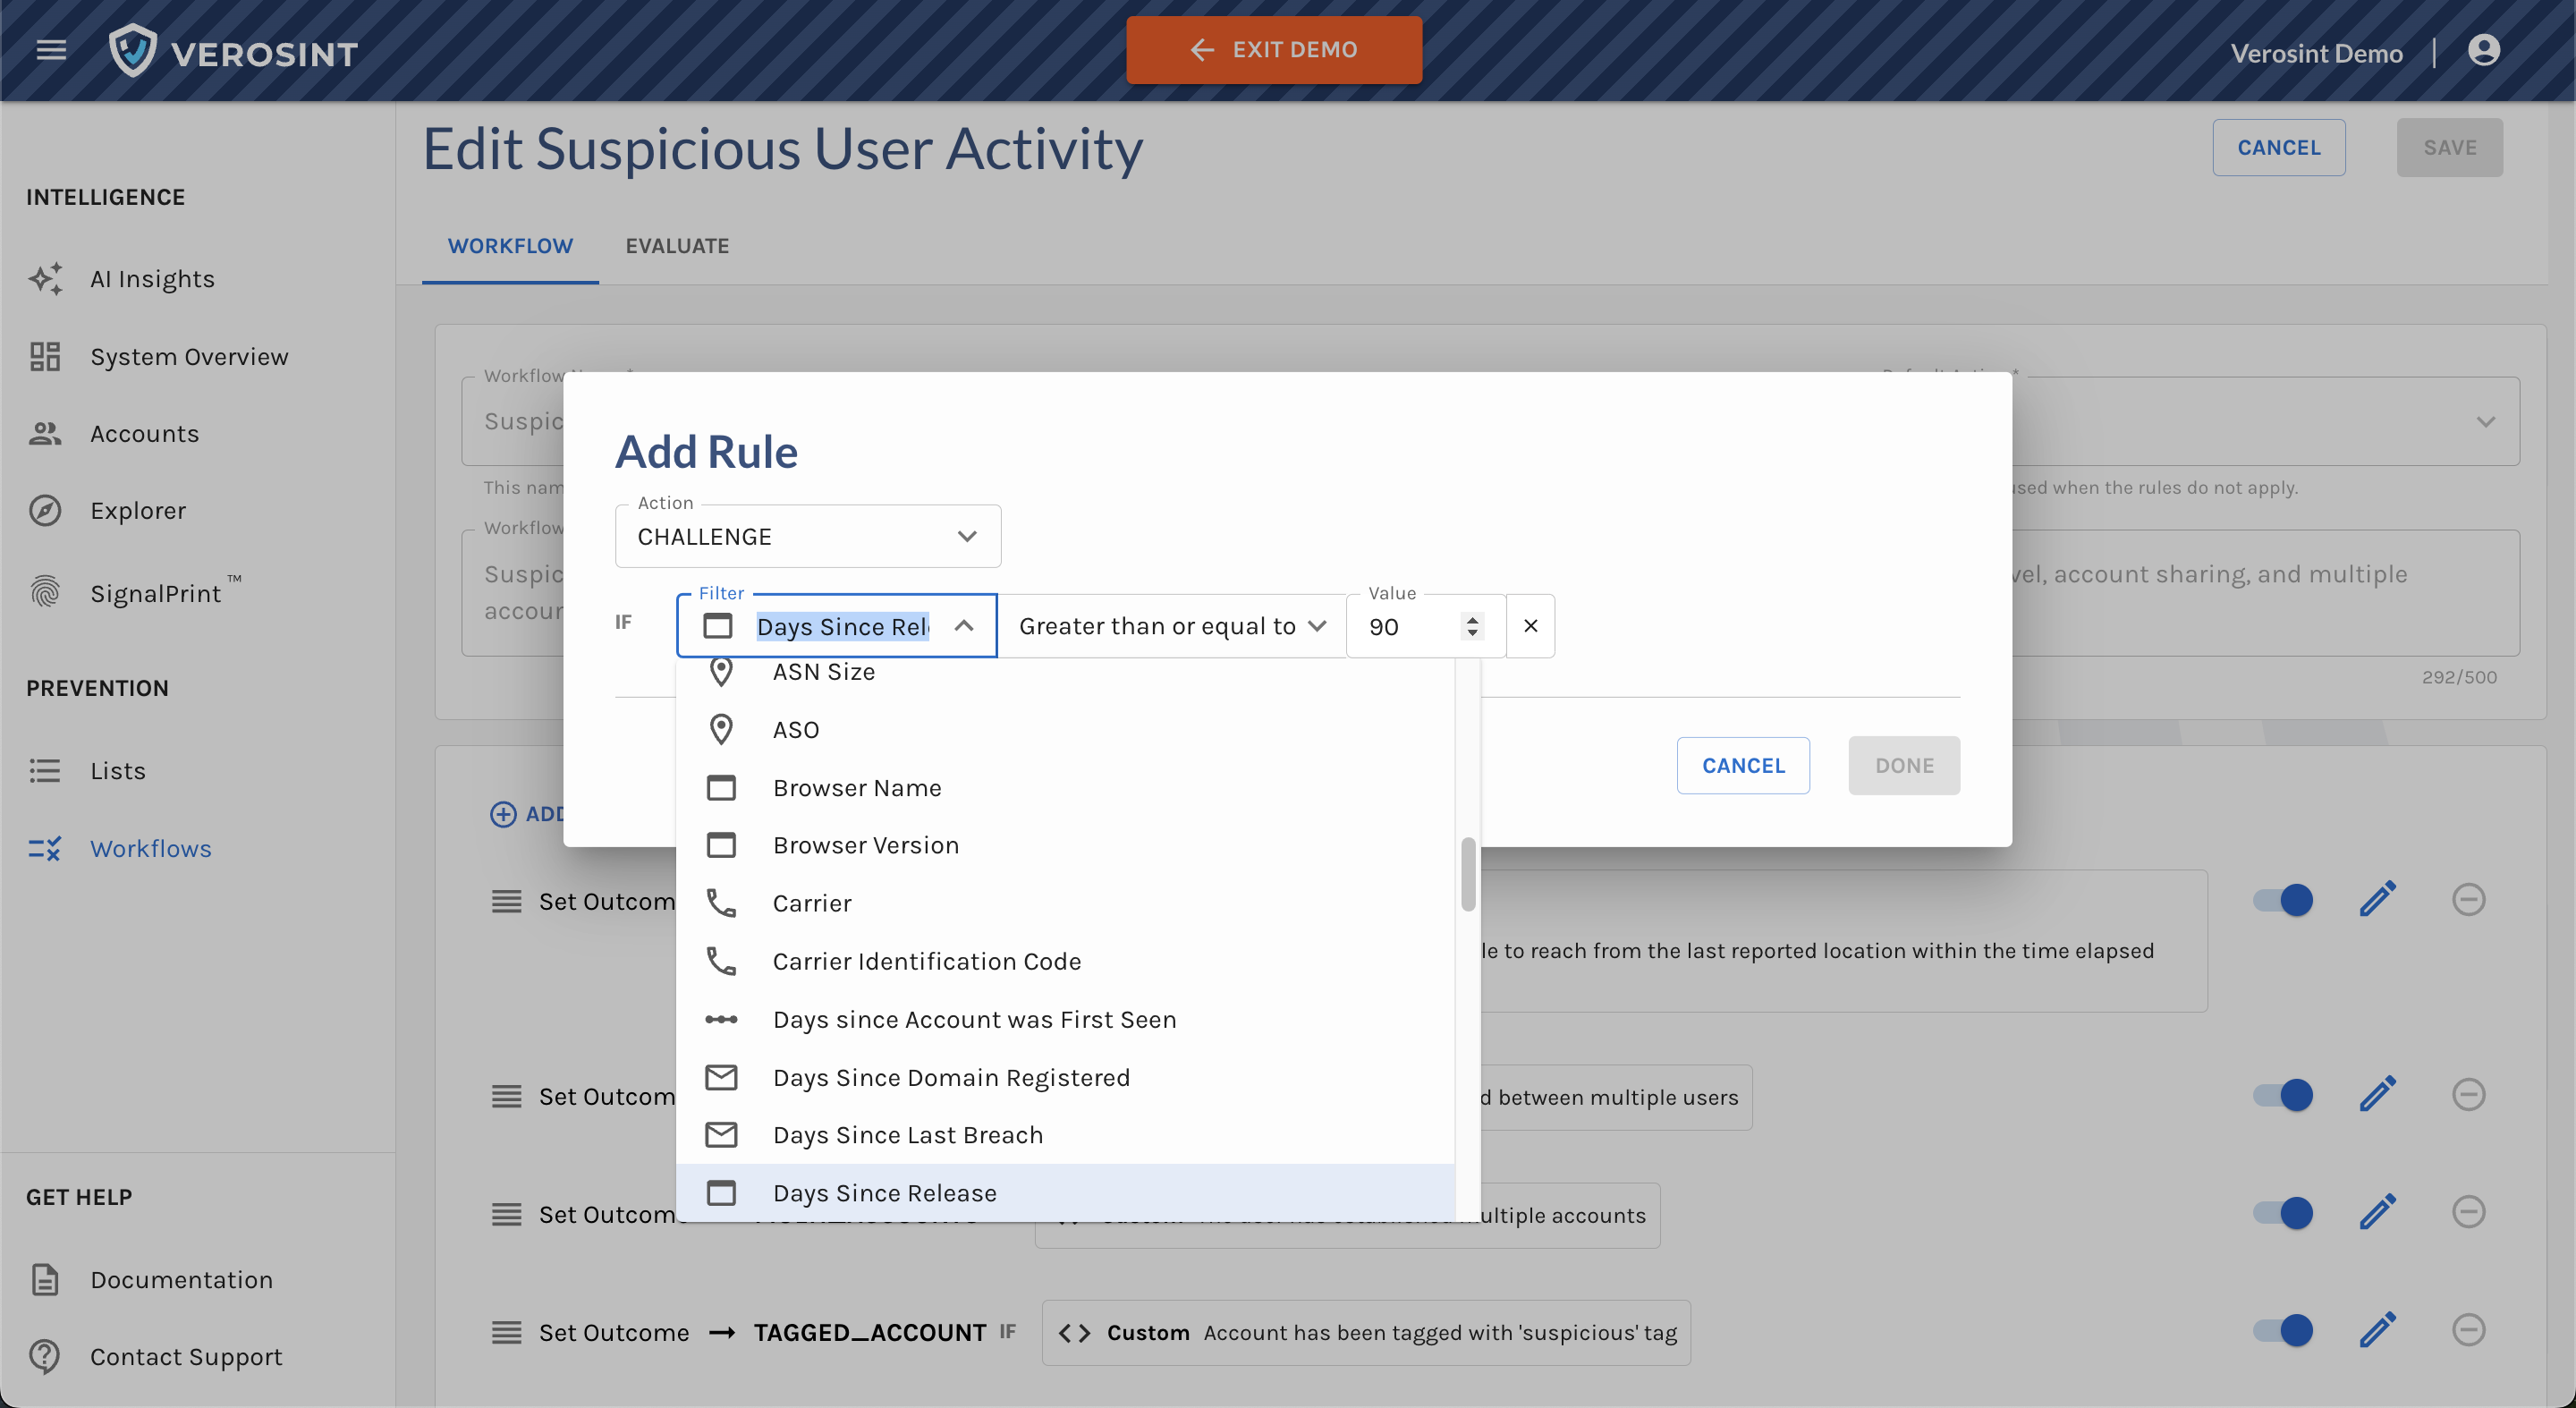
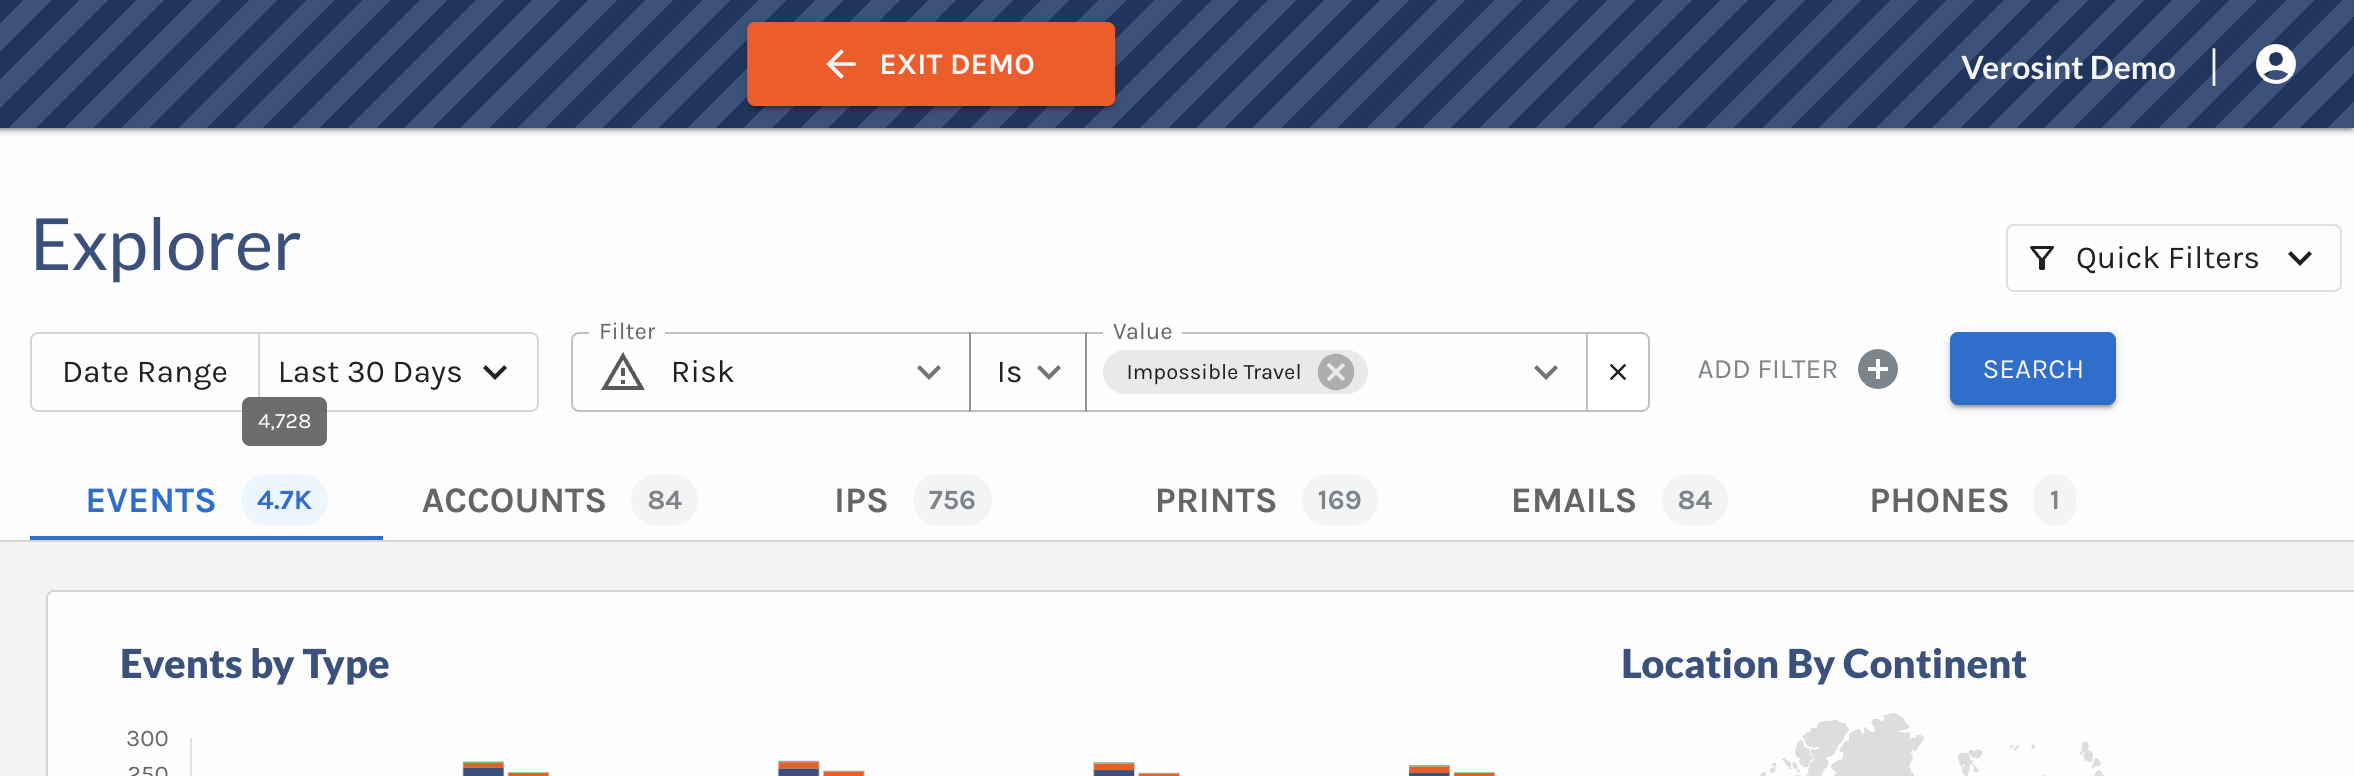
Verosint's new Session Sharing risk signal tells you when multiple users share the same session identifier to access an account authorized for a single user. See who is session sharing in the Event Explorer, or add a rule to your workflow to CHALLENGE or DENY users who are session sharing.
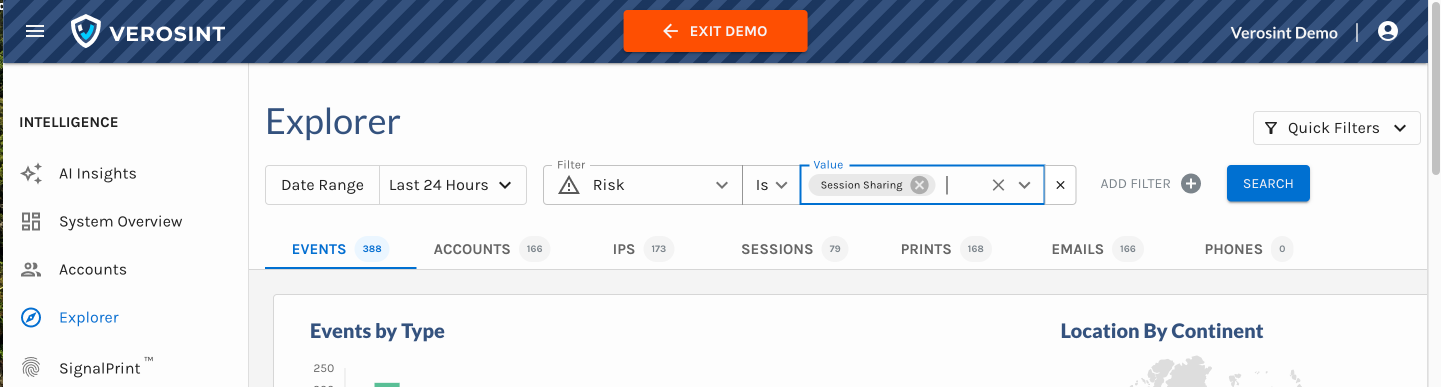
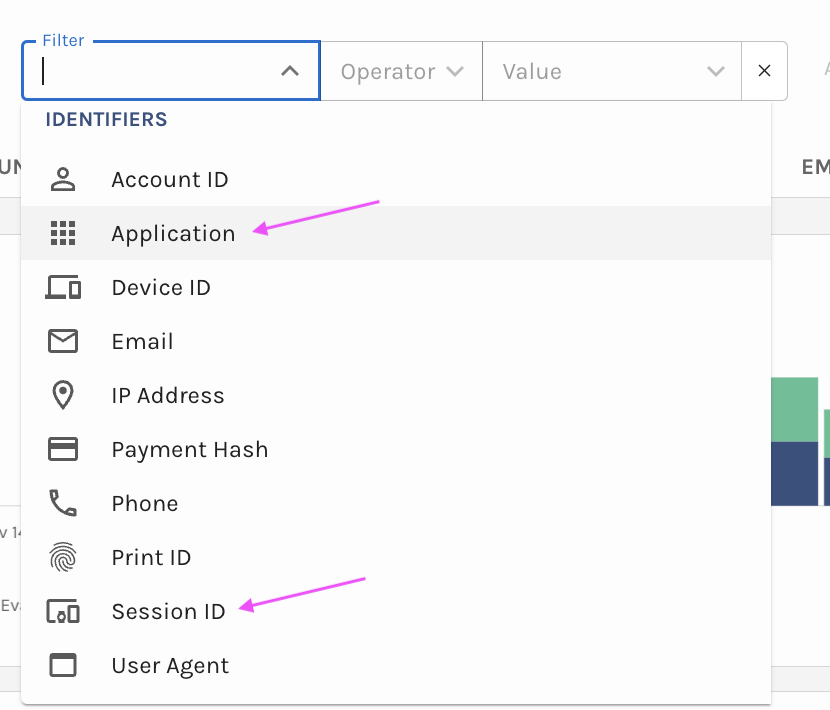
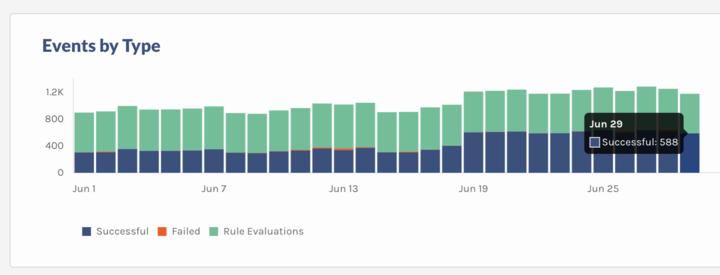
Session Sharing risk signal in Event Explorer
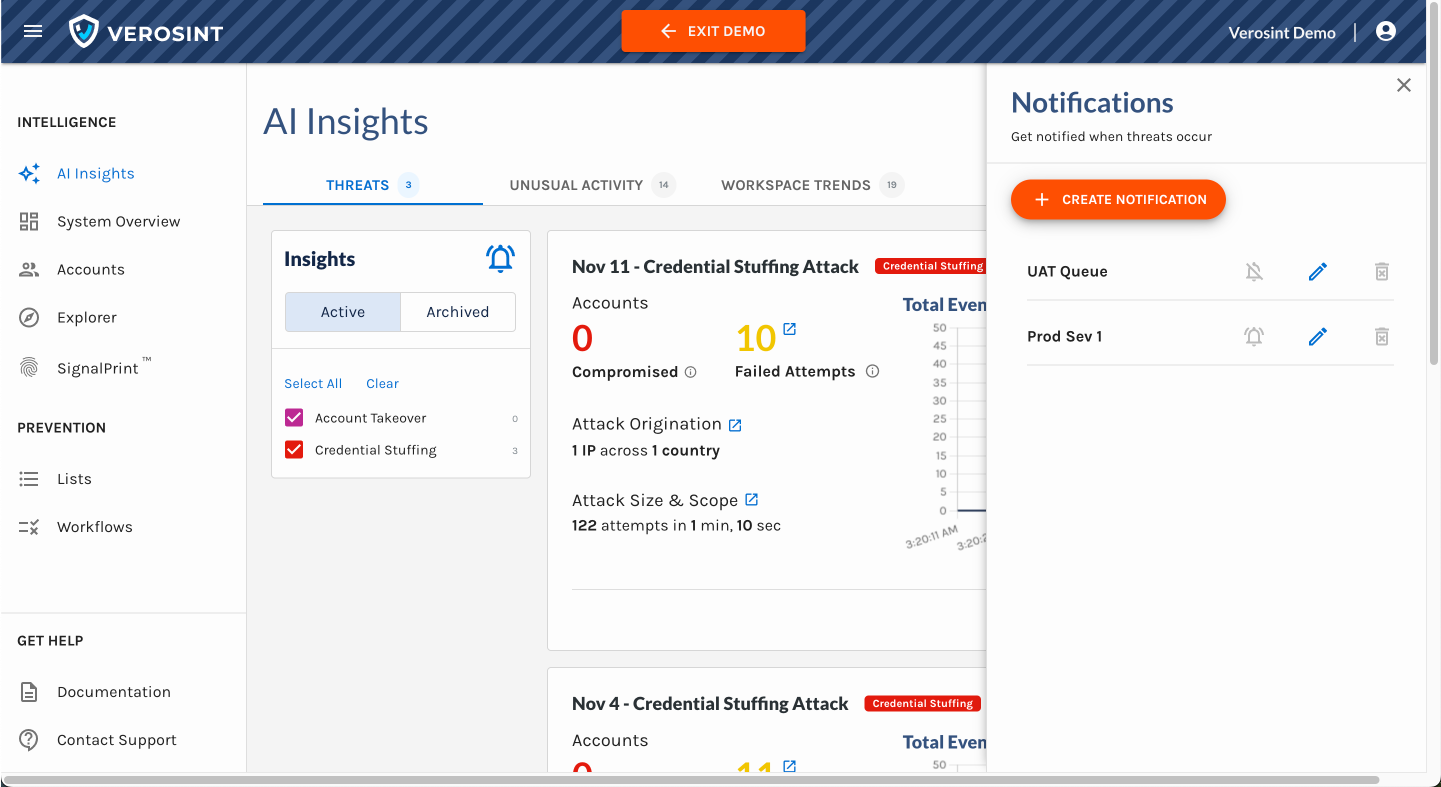
Use Session Sharing in Workflows for real-time prevention
Why Does This Matter?
- Reduced MTTR: The enhanced ATO card provides more context, enabling you to verify faster whether a credential stuffing attack directly led to an account compromise. This makes your response actions more timely, precise, and confident.
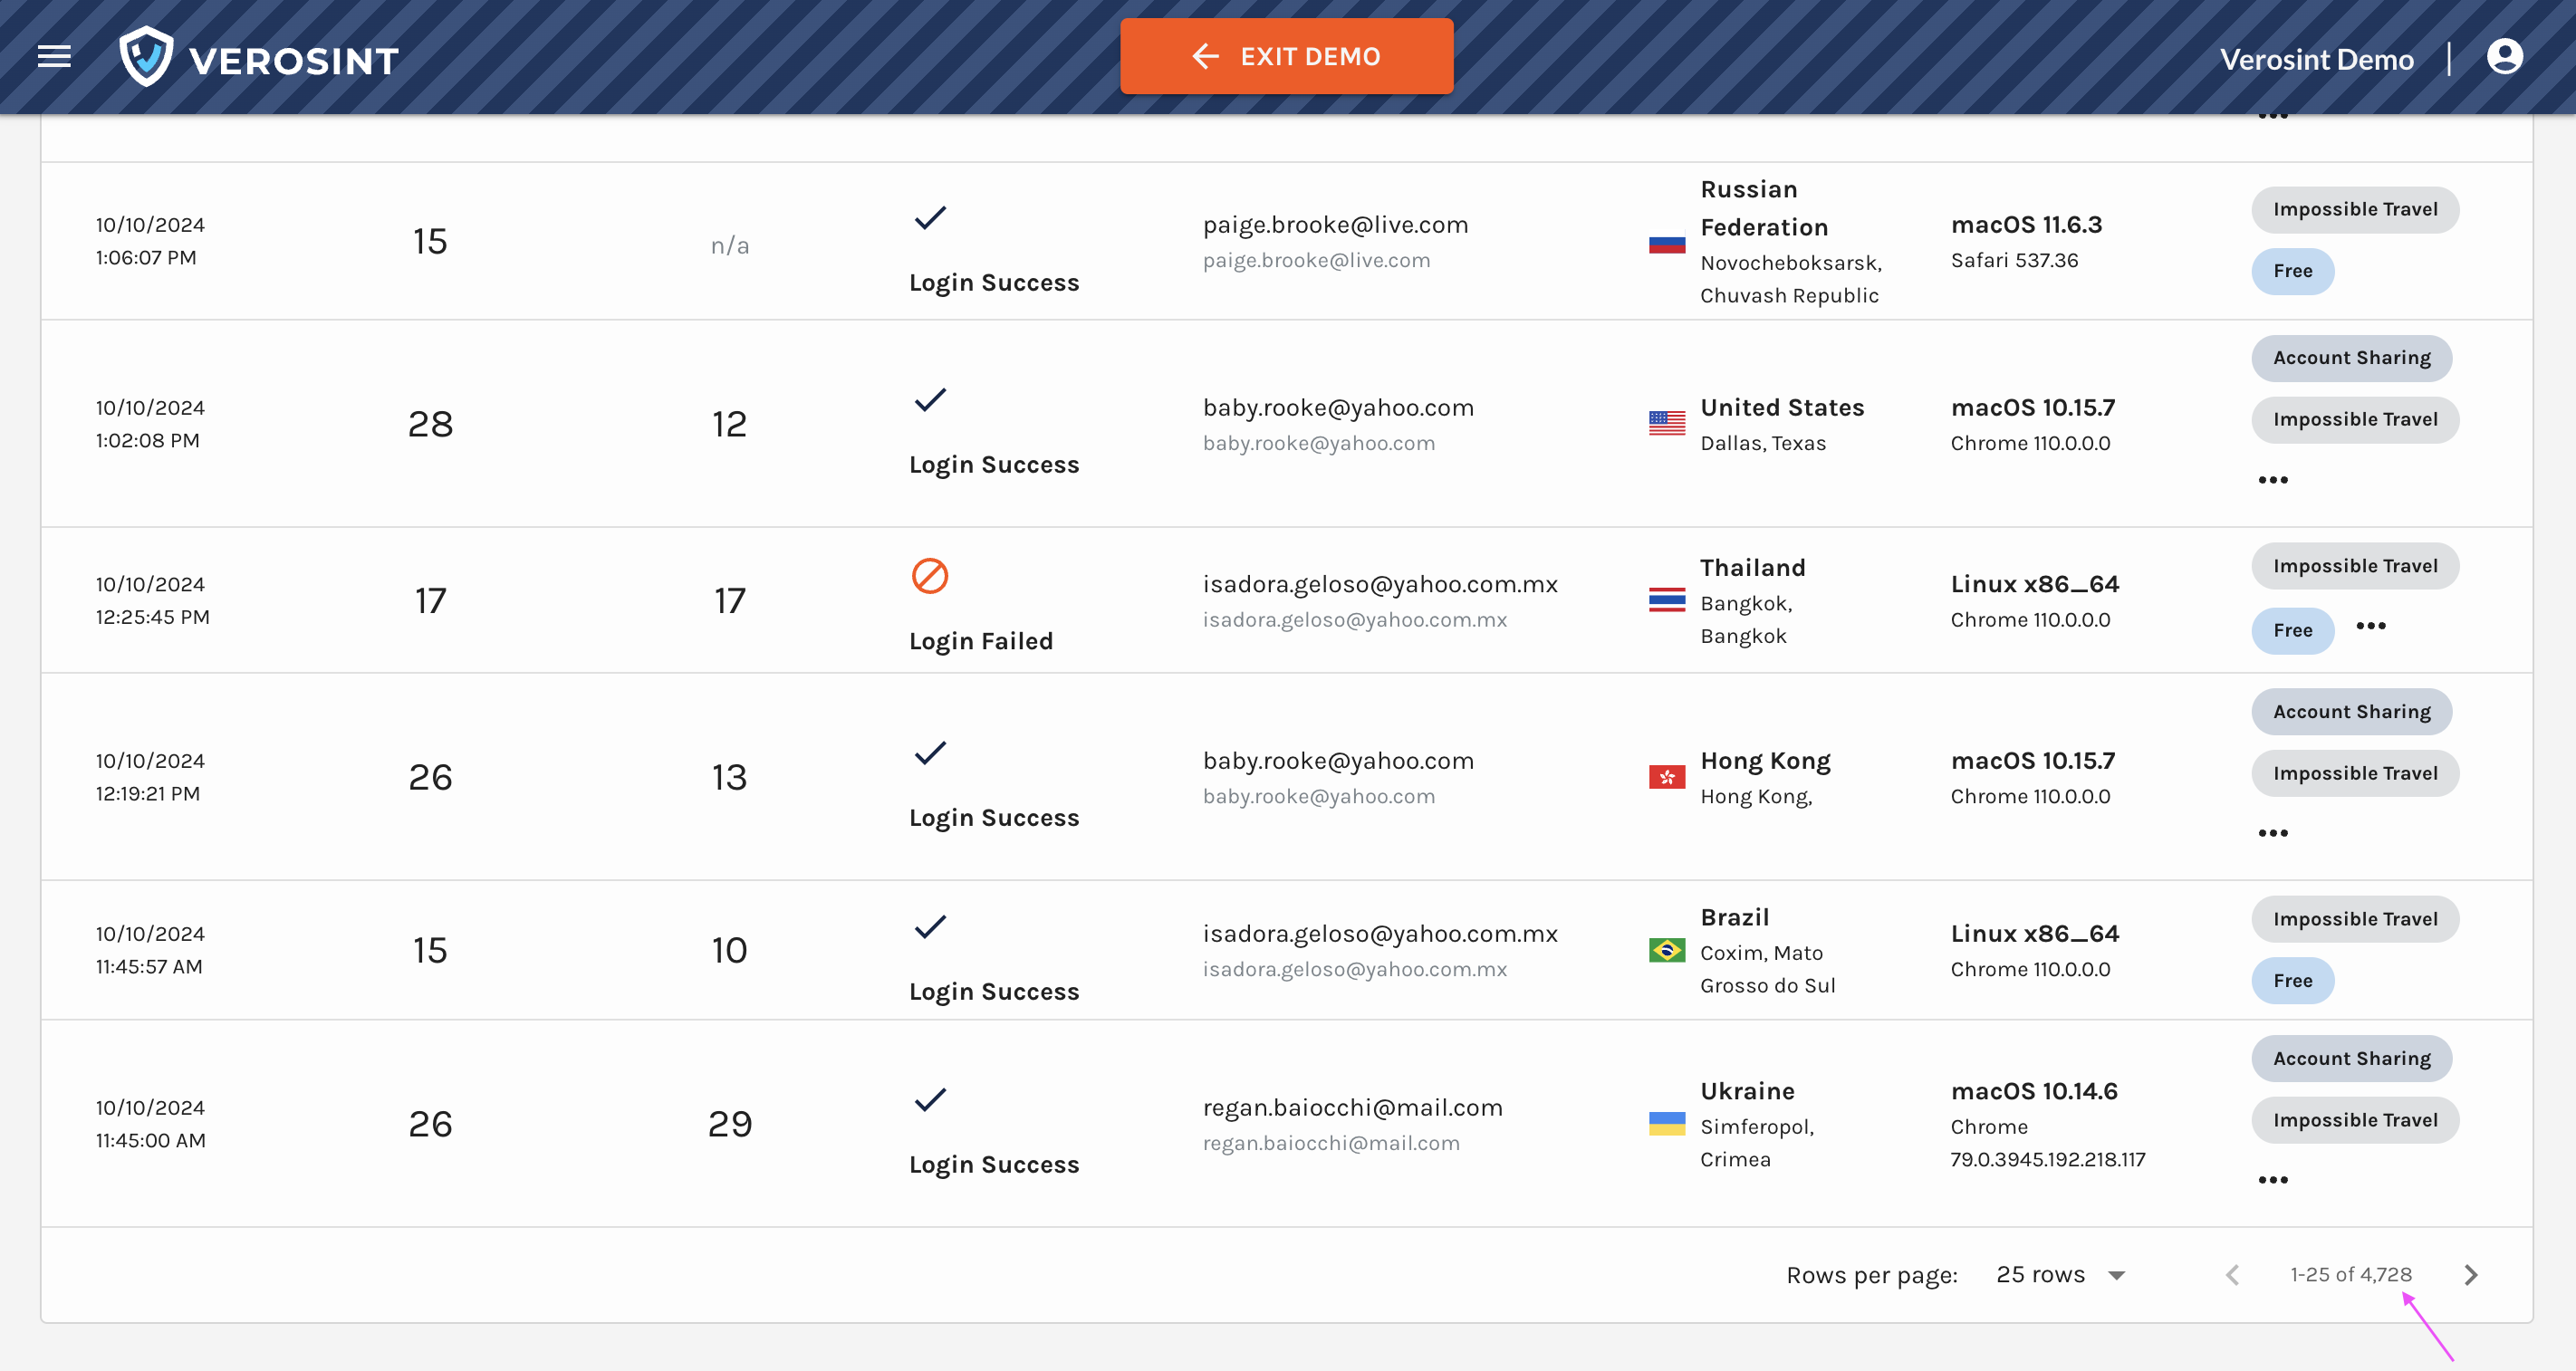
- Easier Detection of Unwanted or Unusual Behavior:
- The updated Accounts table organizes key session-related metrics, making it easier to spot unusual behavior like high device counts or IP diversity, which could signal suspicious activity.
- With the Session Sharing risk signal, you can detect and prevent shared sessions across accounts on your platform.
These improvements are all about making sure you're steps ahead ahead of potentials threats to your platform. As always, we’re here to help if you have feedback or questions!