πŸ””New feature alert!

We just released the Prints, Emails, and Phones tabs in Explorer, making it easier for you to spot suspicious activity on your platform!

Prints - A Print represents a specific device.

  • With the heat map, you can quickly see which prints are generating the most activity on your platform.
  • Keep an eye out for Prints with too many accounts ⚠️ (as in our example below). That may warrant further investigation.

Emails

  • Our Emails tab can provide more context about an account on your platform, especially if that's how your users sign up.
  • We make it easy for you to see newly registered domains ⚠️, which bad actors often use in cybercrimes. See our example data below.

Phones

  • Our Phones tab can provide more context about an account on your platform, especially if that's how your users sign up.
  • Multiple accounts associated with a single phone number can be suspicious.

β™₯️Improvements & Polish πŸ’…

We're always looking for ways to improve your user experience. The latest include:

  • In Explorer, we grey out the GRAPH icon if there has been no activity in the last 30 days (so you're not staring at a blank SignalPrint graph).
  • Did something feel better when you looked at our heat maps? Hint: we added very light grey tiles when there is no activity, making it easier to see when activity did or did not occur.
  • When you search for something in the SignalPrint graph, the nodes don't shift around anymore, making it easier to focus on what you're looking at. πŸ‘€
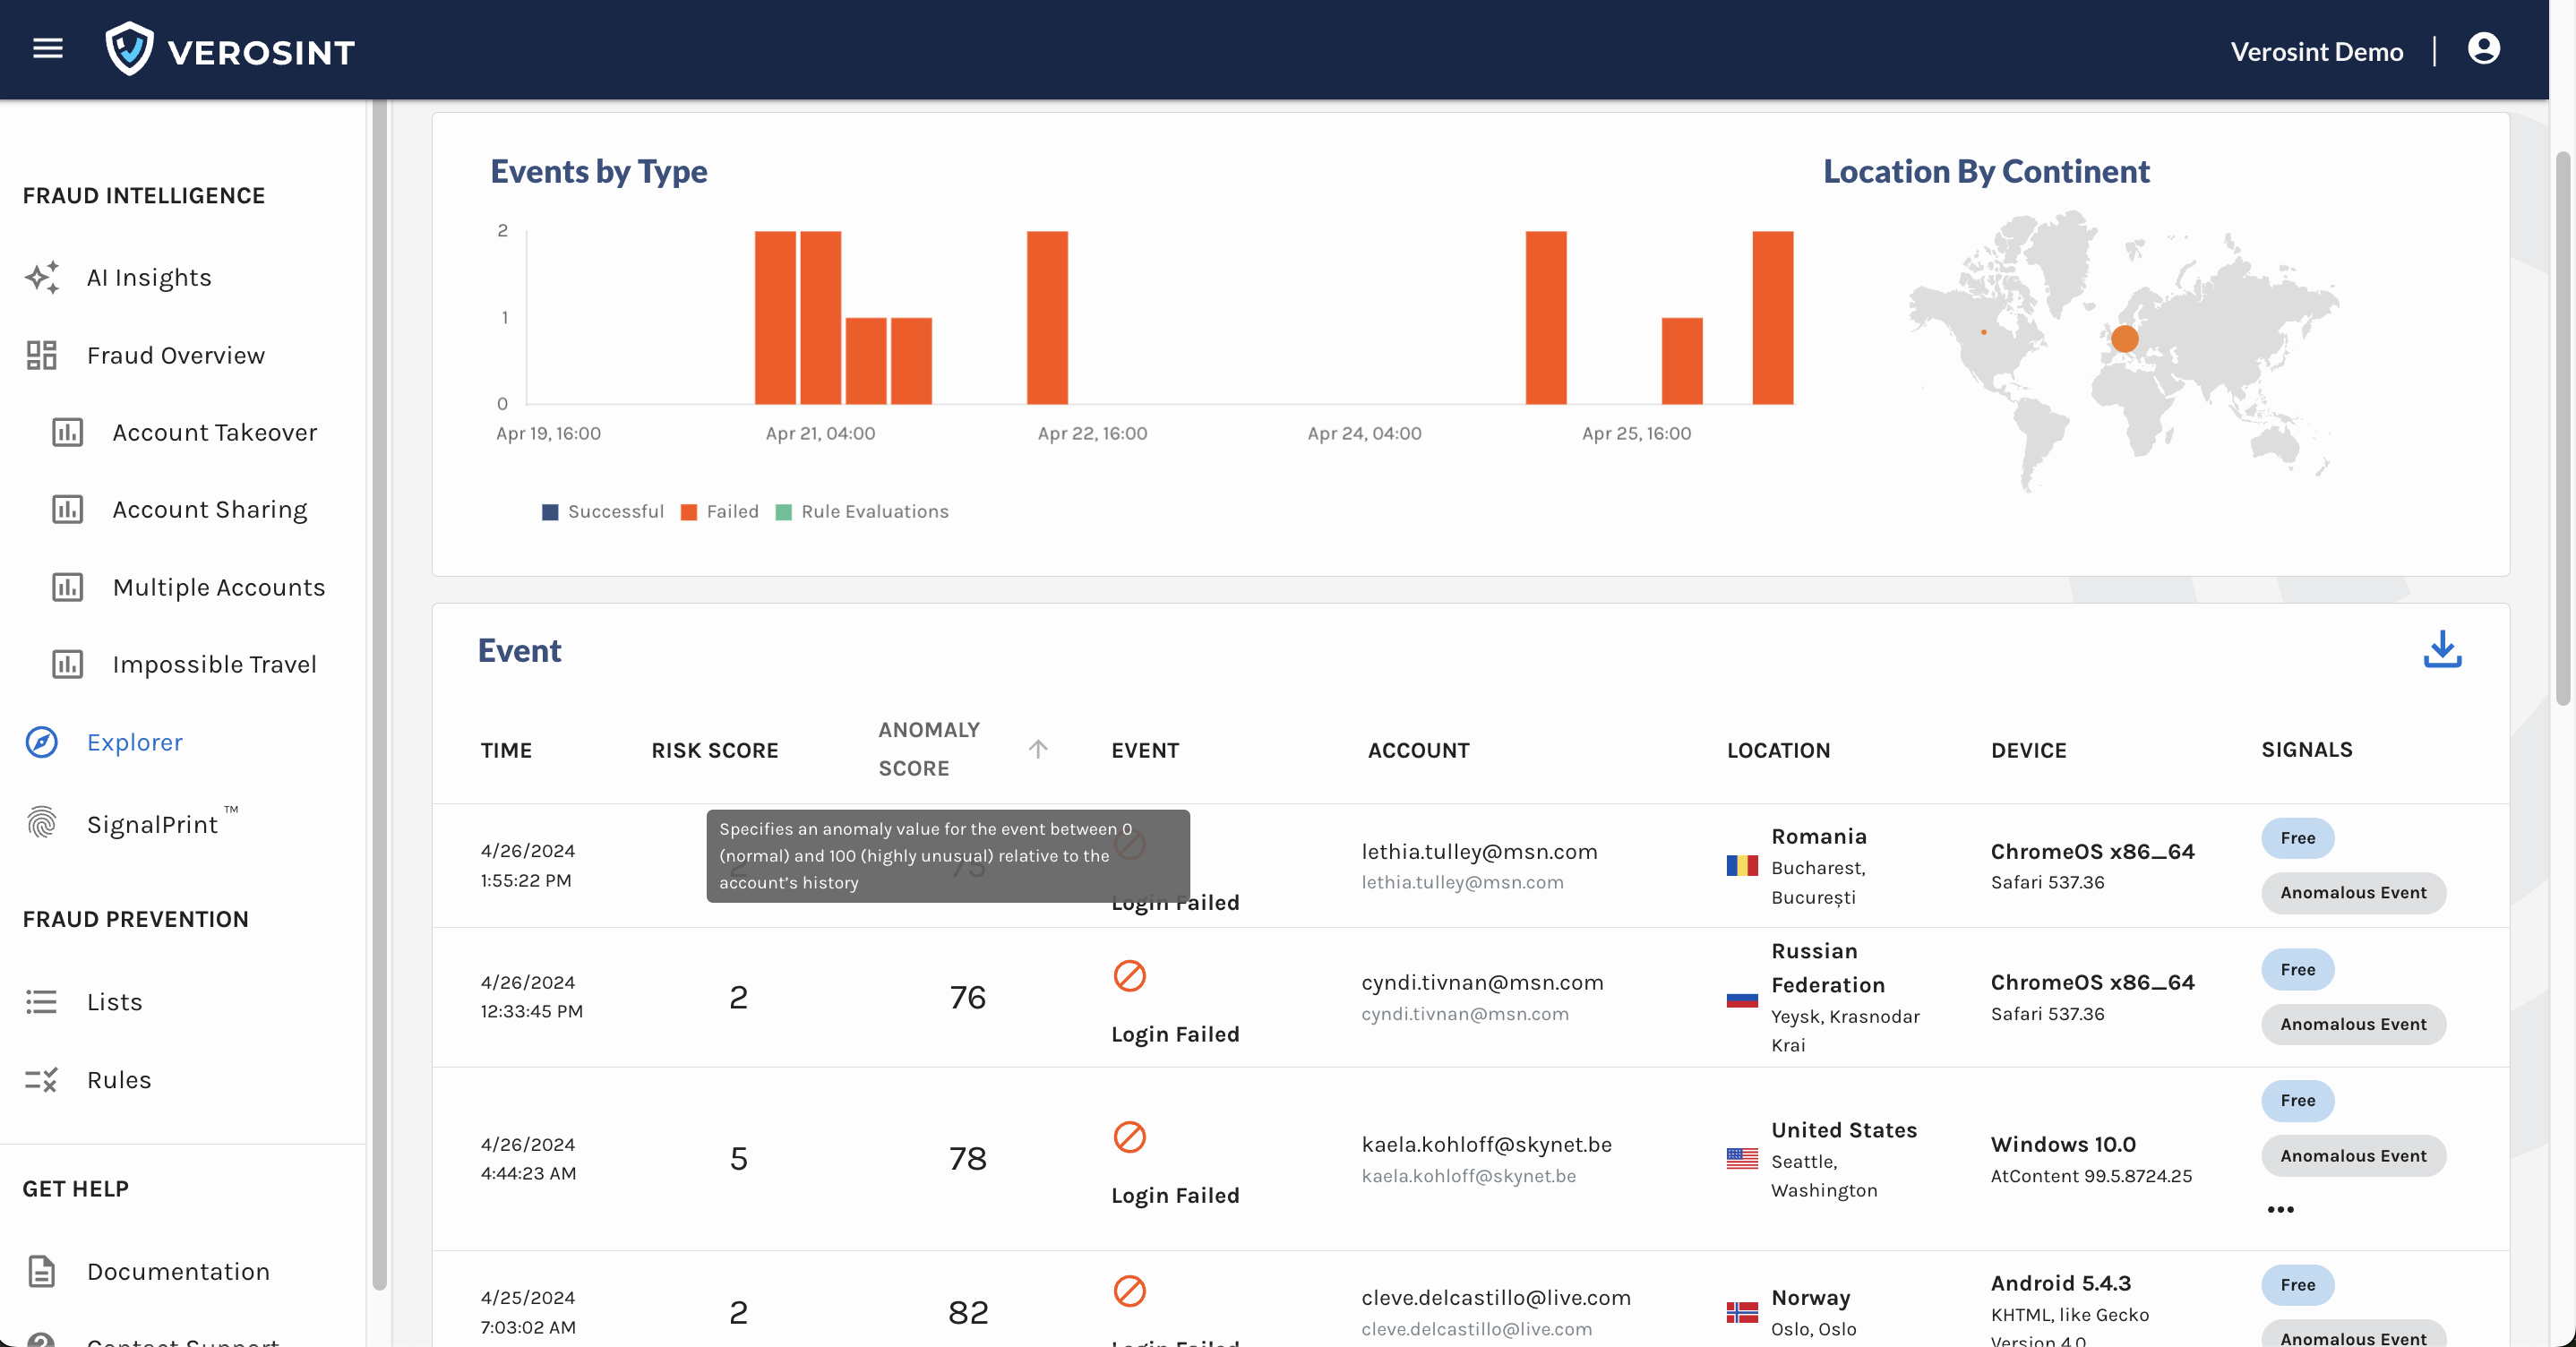
  • We fixed column sorting! Now you can sort columns in either ascending or descending order to quickly spot suspicious activity. ⬇️ ⬆️
  • When you have a team working together and not everyone majored in English, you run into inconsistent names. In our case, there were rules sets and rule sets. We fixed it! (And for the record, they're rule sets πŸ˜‰).
  • There were some cases in the SignalPrint graph where once you expanded all the nodes, the final graph of connections was not always the same. Fixed! βœ…
  • The email.parked signal was missing in a few places in the UI, but now it's back! We recommend using it in the Explorer to search for parked domains, which bad actors can use to redirect users to malicious sites.
  • We improved our email.disposable signal by including an additional 240 domains from one of the big providers, yopmail.com. This makes it easier for you to see if new users are signed up with a disposable email address (which is something bad actors tend to do 🚫).

πŸ””New feature alert!

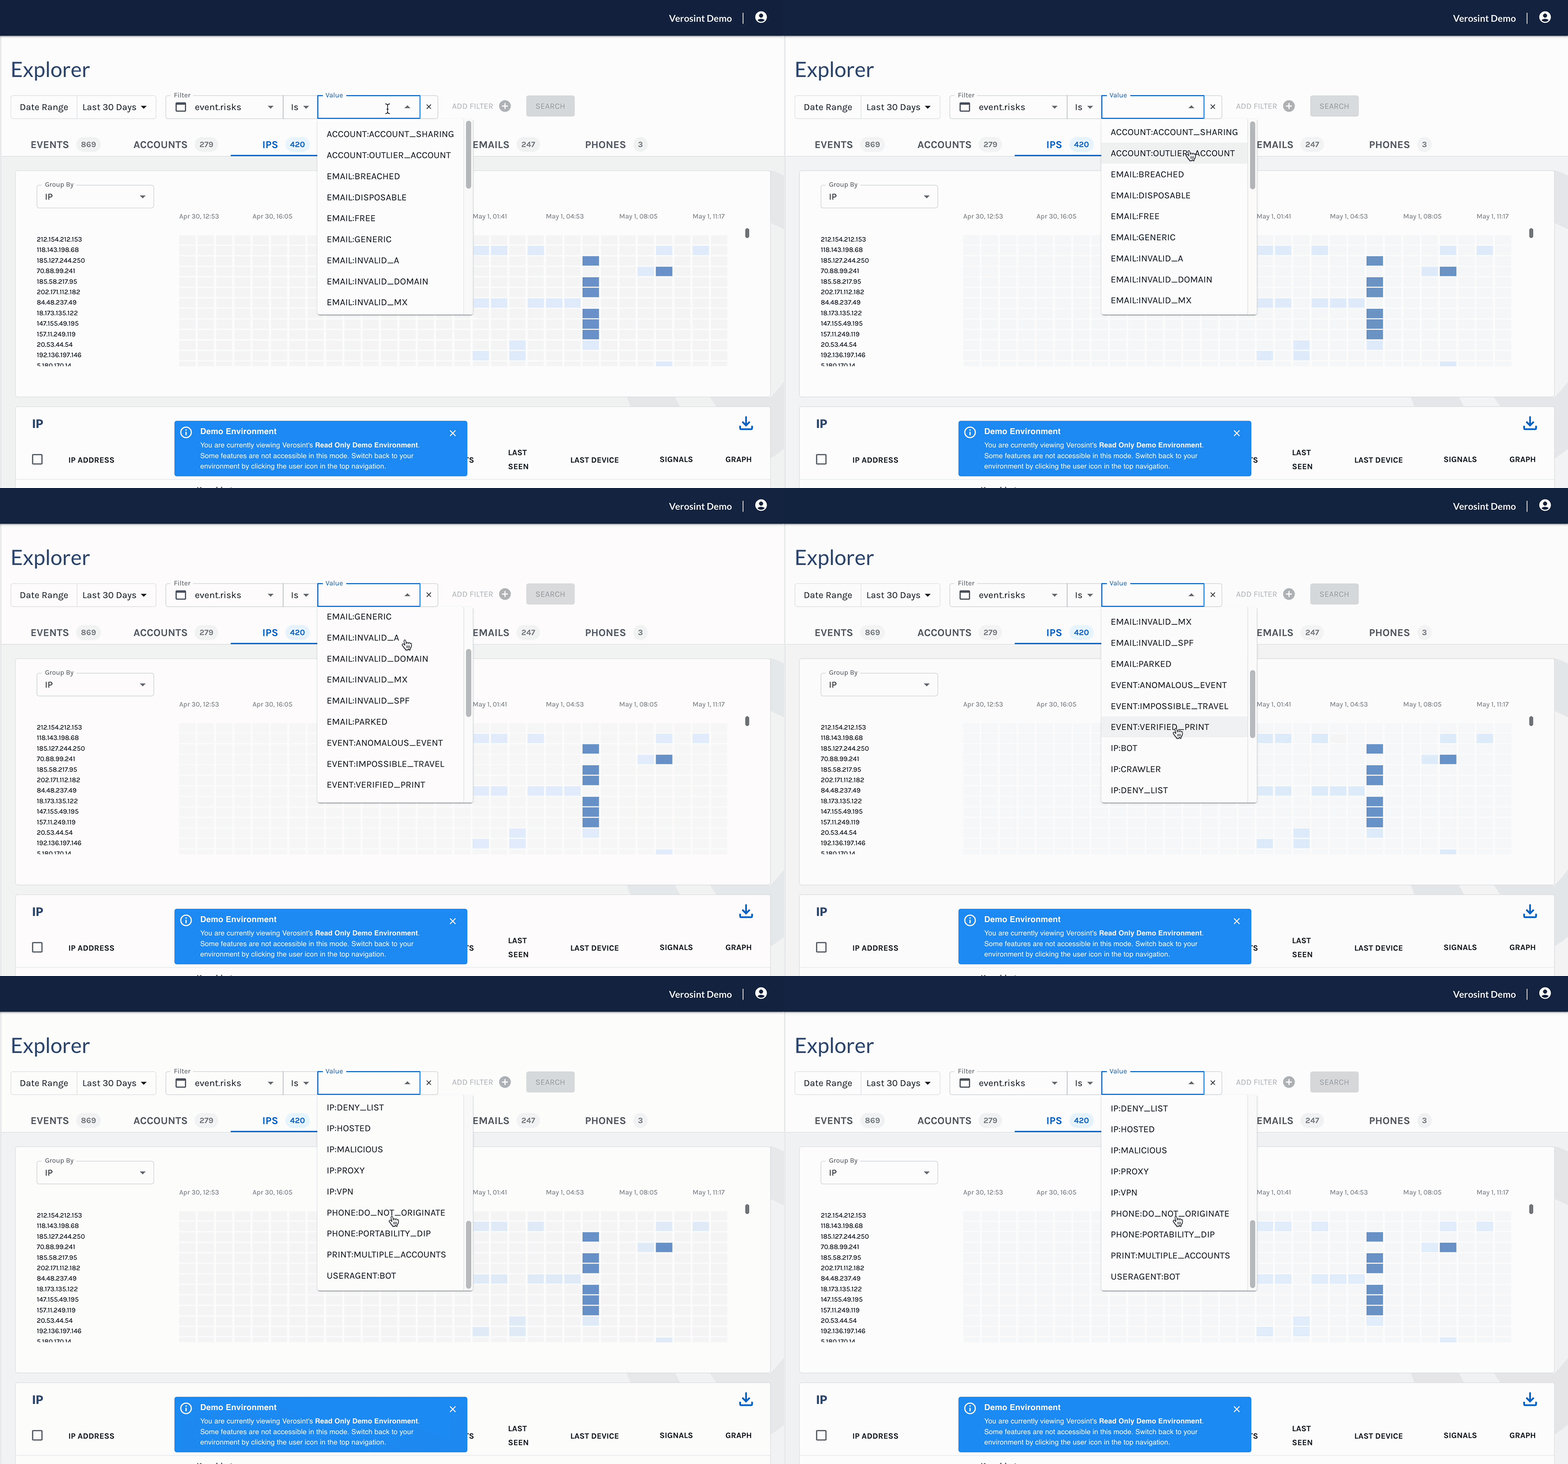
  • We added an IP Address tab to the Explorer experience so that when you look at a set of events, you can also see the IPs associated with that activity.
IP Address tab

Verosint Demo - IP Address tab

The IPs tab includes a heat map of IP activity and a table of results based on your search filter(s). By default, both are sorted to display the IPs with the greatest activity at the top. You can also downloads a CSV of the IPs table.

  • Now you can share your search with a link πŸ”— or πŸ”– bookmark a set of search filters in Explorer

πŸ””New feature alert!

  • We added an Accounts tab to the Explorer experience so that when you look at a set of events, you can also see the accounts associated with that activity.
Verosint Demo - Accounts tab

Verosint Demo - Accounts tab

The Accounts tab includes a heat map chart of account activity and a table of results based on your search filter(s). By default, both are sorted to display the accounts with the greatest activity at the top.

  • πŸ”½ You can also download a CSV of the Events or Accounts table

We're constantly polishing the app to bring you the best user experience!

  • Fixed # of bars displayed regardless of date range selected: In the Events by Type chart, we display a fixed number of bars regardless of the date range selected so that the chart is easier on the πŸ‘€
Fixed number of bars at **Last 12 Hours**

Fixed number of bars at Last 12 Hours

Fixed number of bars at **Last 30 Days**

Fixed number of bars at Last 30 Days

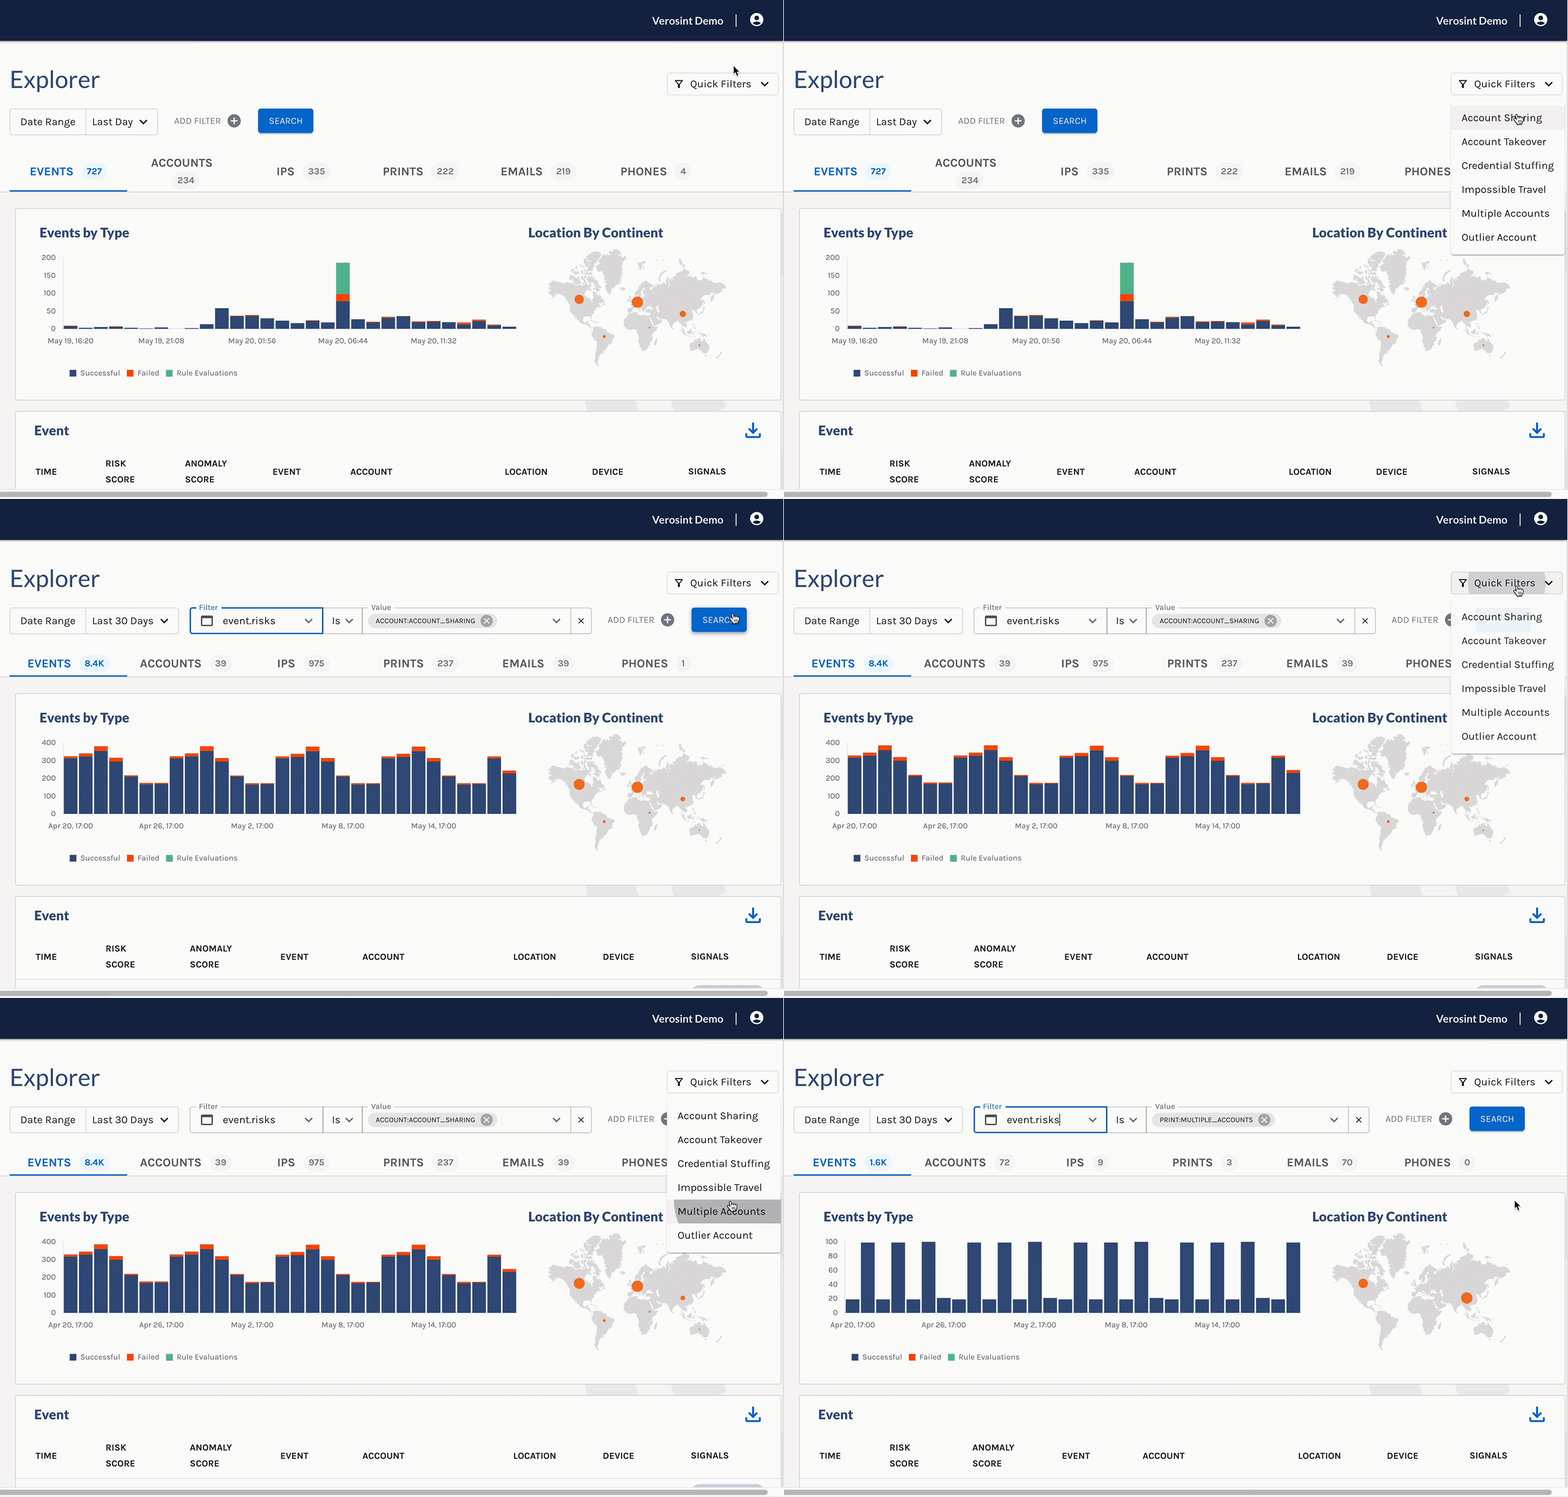
  • More intuitive search process in Explorer
    • When you type in value(s) for filters that accept multiple inputs, clicking away or pressing the tab button will automatically activate the Search button, making it faster for you to get results
    • We also renamed the "Filter" button to "Search" instead πŸ”

πŸ””New feature alert! We released some new features today that make it easier for you to discover and prevent fraud with Verosint.

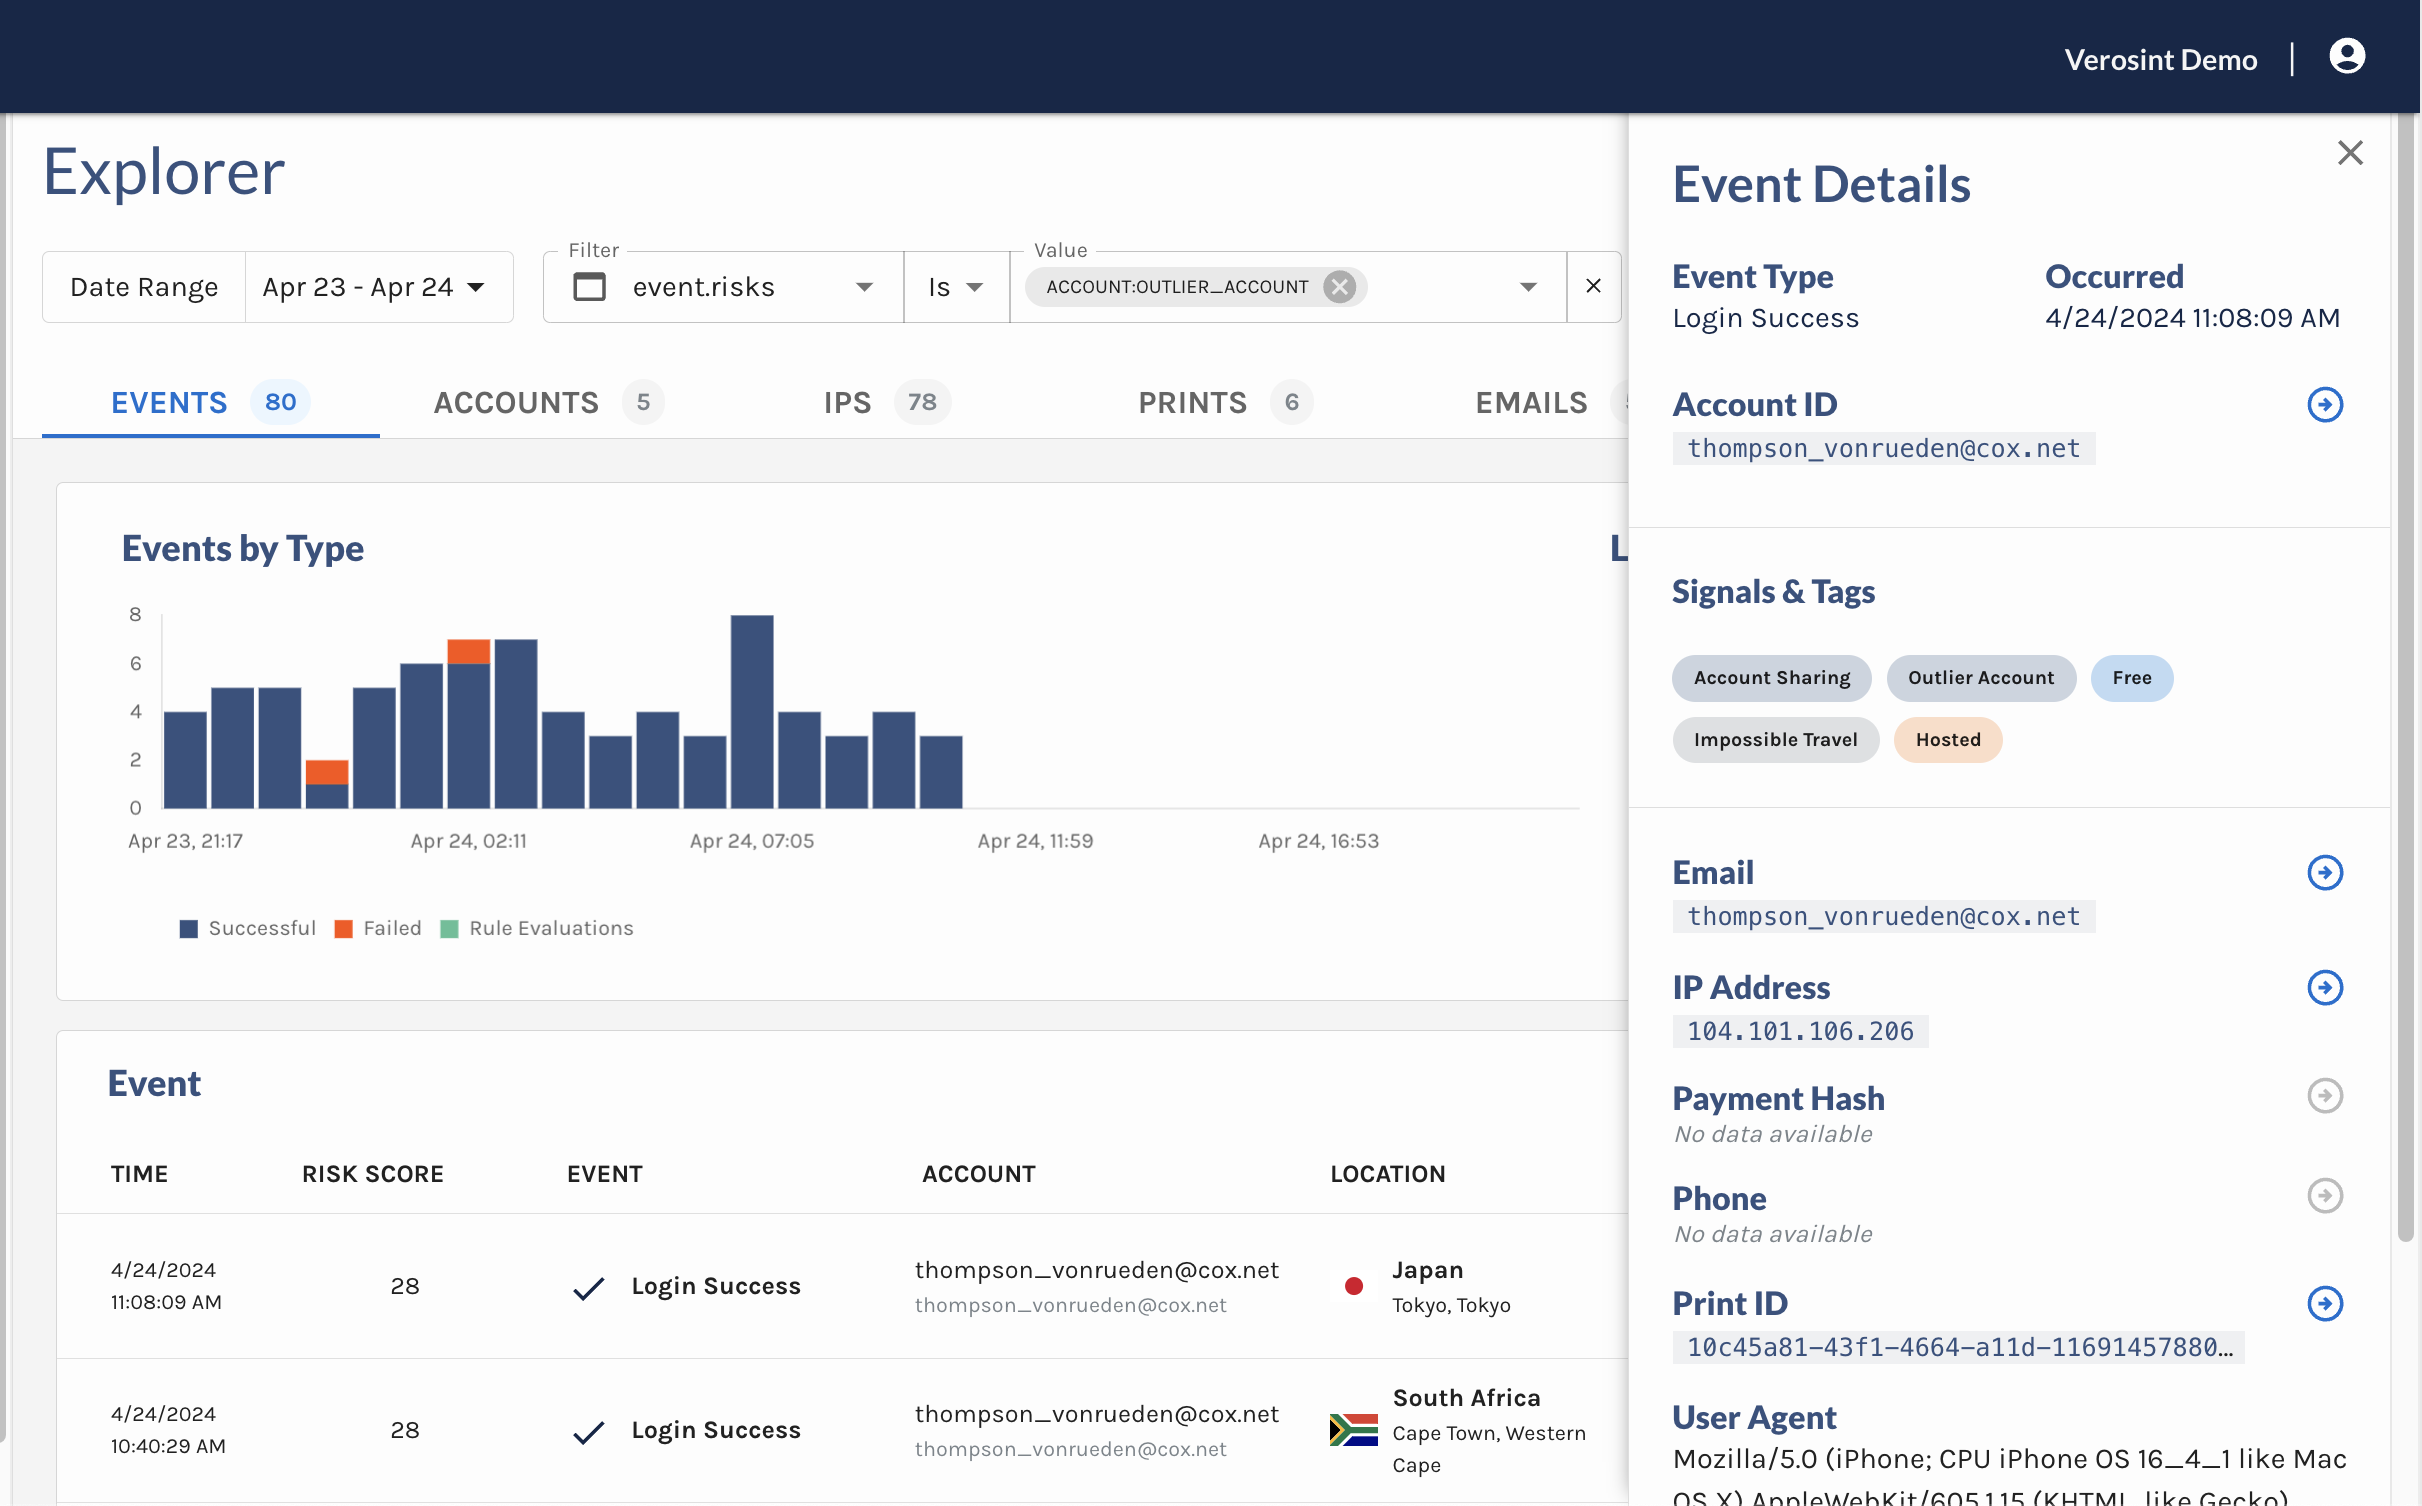
  • Explorer:Now you can quickly discover and investigate potential fraud when looking across user activity with the Explorer. Learn more about it in Using the Explorer.
  • With our Excluded Accounts feature, you can exclude automated, synthetic, and other test data from being processed so that it doesn't pollute your real, business data. This makes it easier for you to analyze and understand your customer activity.
  • We've also separated your user profile settings from your workspace settings into their own separate pages
    User Profile

We are continuously improving the algorithm for SignalPrint (TM), Verosint's patent-pending technique that identifies and recognizes a user's digital footprint. With this update, we detect fraud from Multiple Accounts with increased accuracy for you (so you don't have to πŸ˜‰).

Searching in your SignalPrint graph just got easier with our autocomplete feature. See all your options as you type!

We've released the SignalPrint Explorer v2 graph, which makes it easier for you to choose a specific starting point and do a targeted investigation of potentially fraudulent activity.

Highlights include:

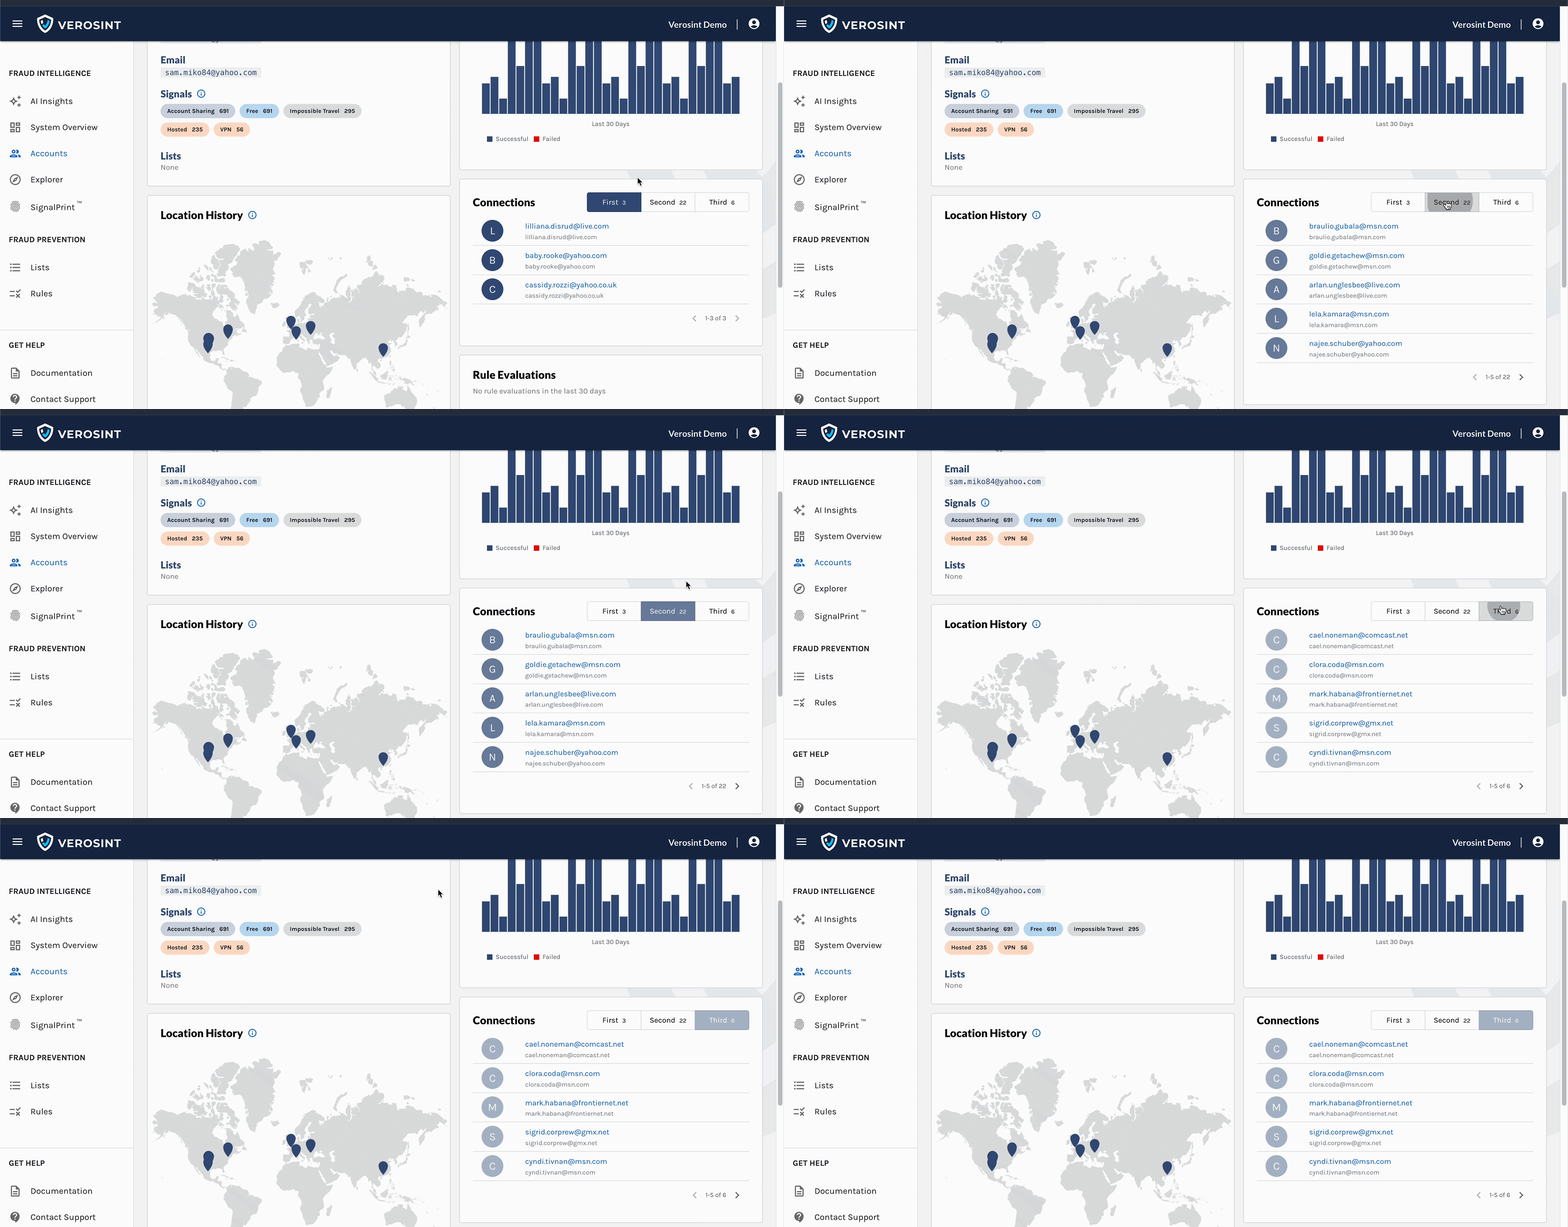
  • Introducing the expanding node! When you first load a cluster, we display the direct connections (one degree away). If there are additional nodes, we display a multi-colored ring around the node - so you can walk the graph as you choose while investigating connections.
  • In addition to our Account, Email, IP, and Print info panels, you can now click on a line between an Account and Print node to see the Connection History info panel.
    [block:image]
    {
    "images": [
    {
    "image": [
    "https://files.readme.io/0eb6b0d-Screenshot_2023-09-11_at_12.17.02_PM.png",
    "",
    ""
    ],
    "align": "center"
    }
    ]
    }
    [/block]
  • There's a summary in the bottom left corner that displays the total # of nodes by type. This updates as you (un)select nodes on the graph.
  • In addition to Account and Print nodes, we've introduced email πŸ“§, IP address, and phone number πŸ“ž nodes - making it easier to see which identifier details are associated with a given account.
  • It loads faster! ⚑

We’ve added two new signals ip.relay and ip.locationID!

ip.relay tells you if this IP is a private relay service IP address (such as Apple relay, Cloud flare, or Akamai). A wonderful addition to our other anonymity detection signals.

ip.locationID gives you a unique identifier assigned to the location by GeoNames.

You’ll also notice that our web app URLs now have a unique ID in them. This is your workspace ID and makes it easy to share links with co-workers when you have multiple workspaces.

You can now see the event type of an event when looking at the event history in the SignalPrint Graph.