🔔 New feature alert! Verosint's AI Insights shows you where there might be fraud on your platform by pointing out unusual activity and workspace trends.
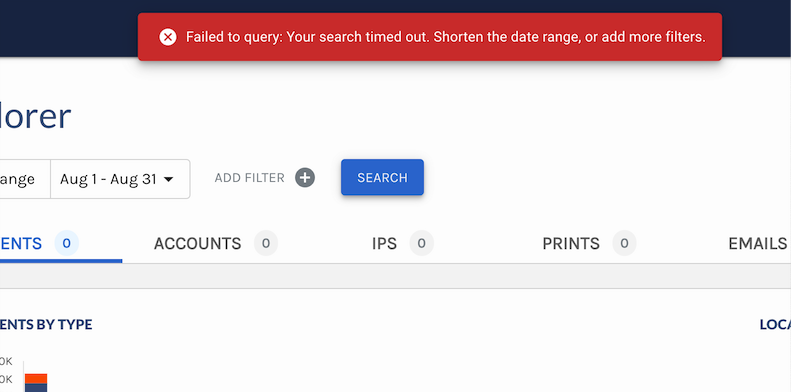
The process to determine if suspicious activity on your platform is actually fraud is like looking for a needle in a haystack. With AI Insights, Verosint highlights workspace trends and unusual activity -- so you don't have to look for it.
Verosint's AI Insights looks across your user activity and points out potential fraud, so you don't have to go digging for it