Using SignalPrint
After you have uploaded a set of customer account information or integrated with the SignalPrint API Events endpoint, either from the command line or through the SignalPrint API, you can see your users’ account and event history on the SignalPrint page. You can navigate to a specific account or event by clicking a link in any one of the dashboards, or you can enter an identifier in the search box on the SignalPrint page.
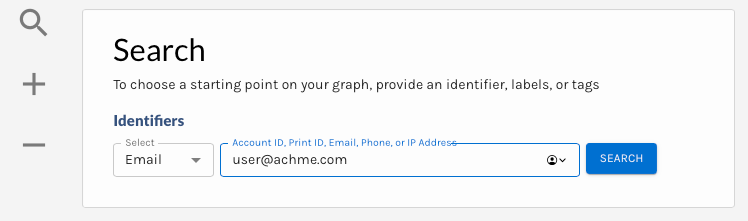
SignalPrint Search
The SignalPrint page displays up to 1000 nodes at once. Nodes are color-coded to show Account, Email, IP Address, and Phone. Nodes with additional information are multi-colored and listed as Expanding Nodes in the legend at the bottom of the page.
Print IDThe Print ID is the unique identifier generated for a device based on IP address and user agent. If a device ID is supplied when sending events to Verosint, that ID is used to generate a Print ID.
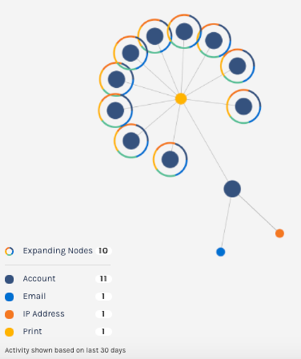
SignalPrint Nodes
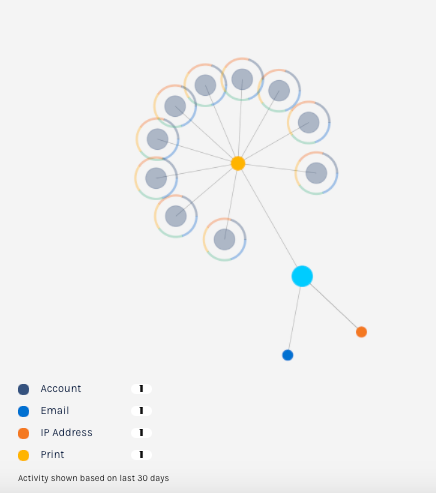
- Click a node to expand its history.
- Click the (+) or (-) icons to zoom in and out.
- Click and drag in the graph to move the image.
- Click the menu to the right of the account ID to add it to a list, view it in Account Intelligence, or view it in Explorer.
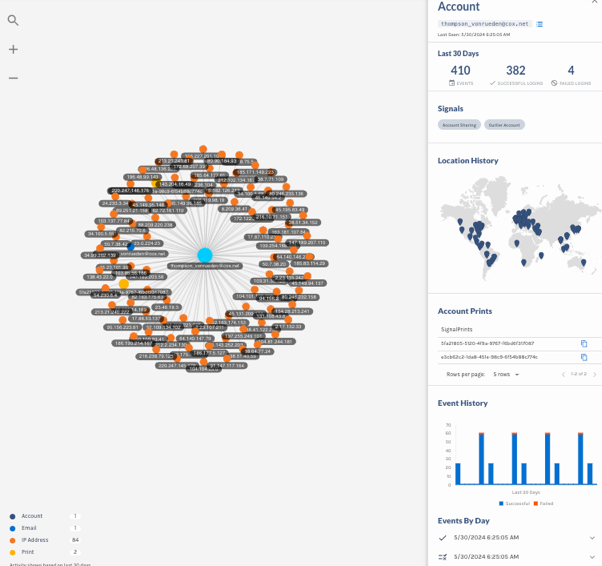
SignalPrint Account View
IP LocationsEach IP address for an account is represented on the IP Locations map. Red location markers mean that a signal was associated with the IP address, such as a possible proxy or bot.
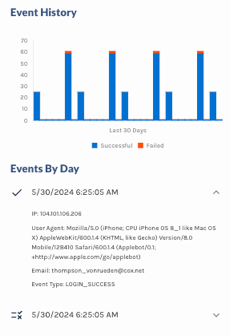
Click in the Histogram for Event details, or view details by day: