
Dashboard
Overview
The Overview tab provides a clear, measurable view of security outcomes—helping you track risk reduction, operational efficiency, and the business impact of your ITDR investment. Use the date range selector to see Critical Threats, High Threats, Resolved Threats, Mean Time to Remediate (MTTR), and Rate of Compromise over specific periods of time.
- Critical Threats: This tile displays the number of critical severity threats that were generated during the date range selected. Critical severity threats indicate compromised accounts, such as Account Takeover and Session Sharing.
- High Threats: This tile displays the number of high severity threats that were generated during the date range selected. High severity threats indicate attacks in and on your workspace, such as Brute Force Attack, Credential Stuffing Attack, MFA Fatigue Attack, and MFA Location Mismatch.
- Resolved Threats: This tile displays the number of threats that were resolved during the date range selected, broken down by sub-status: Remediated, No Action Taken, or False Positive.
- Mean Time To Remediate (MTTR): This tile displays the average time it takes for all threats to transition from Active to Resolved: Remediated, providing insight into your team's threat resolution speed and efficiency.
- Rate of Compromise %: This tile displays the number of unique compromised accounts over the number of unique accounts that were attacked over the selected date range, providing insight into the effectiveness of your defenses in preventing account takeovers.
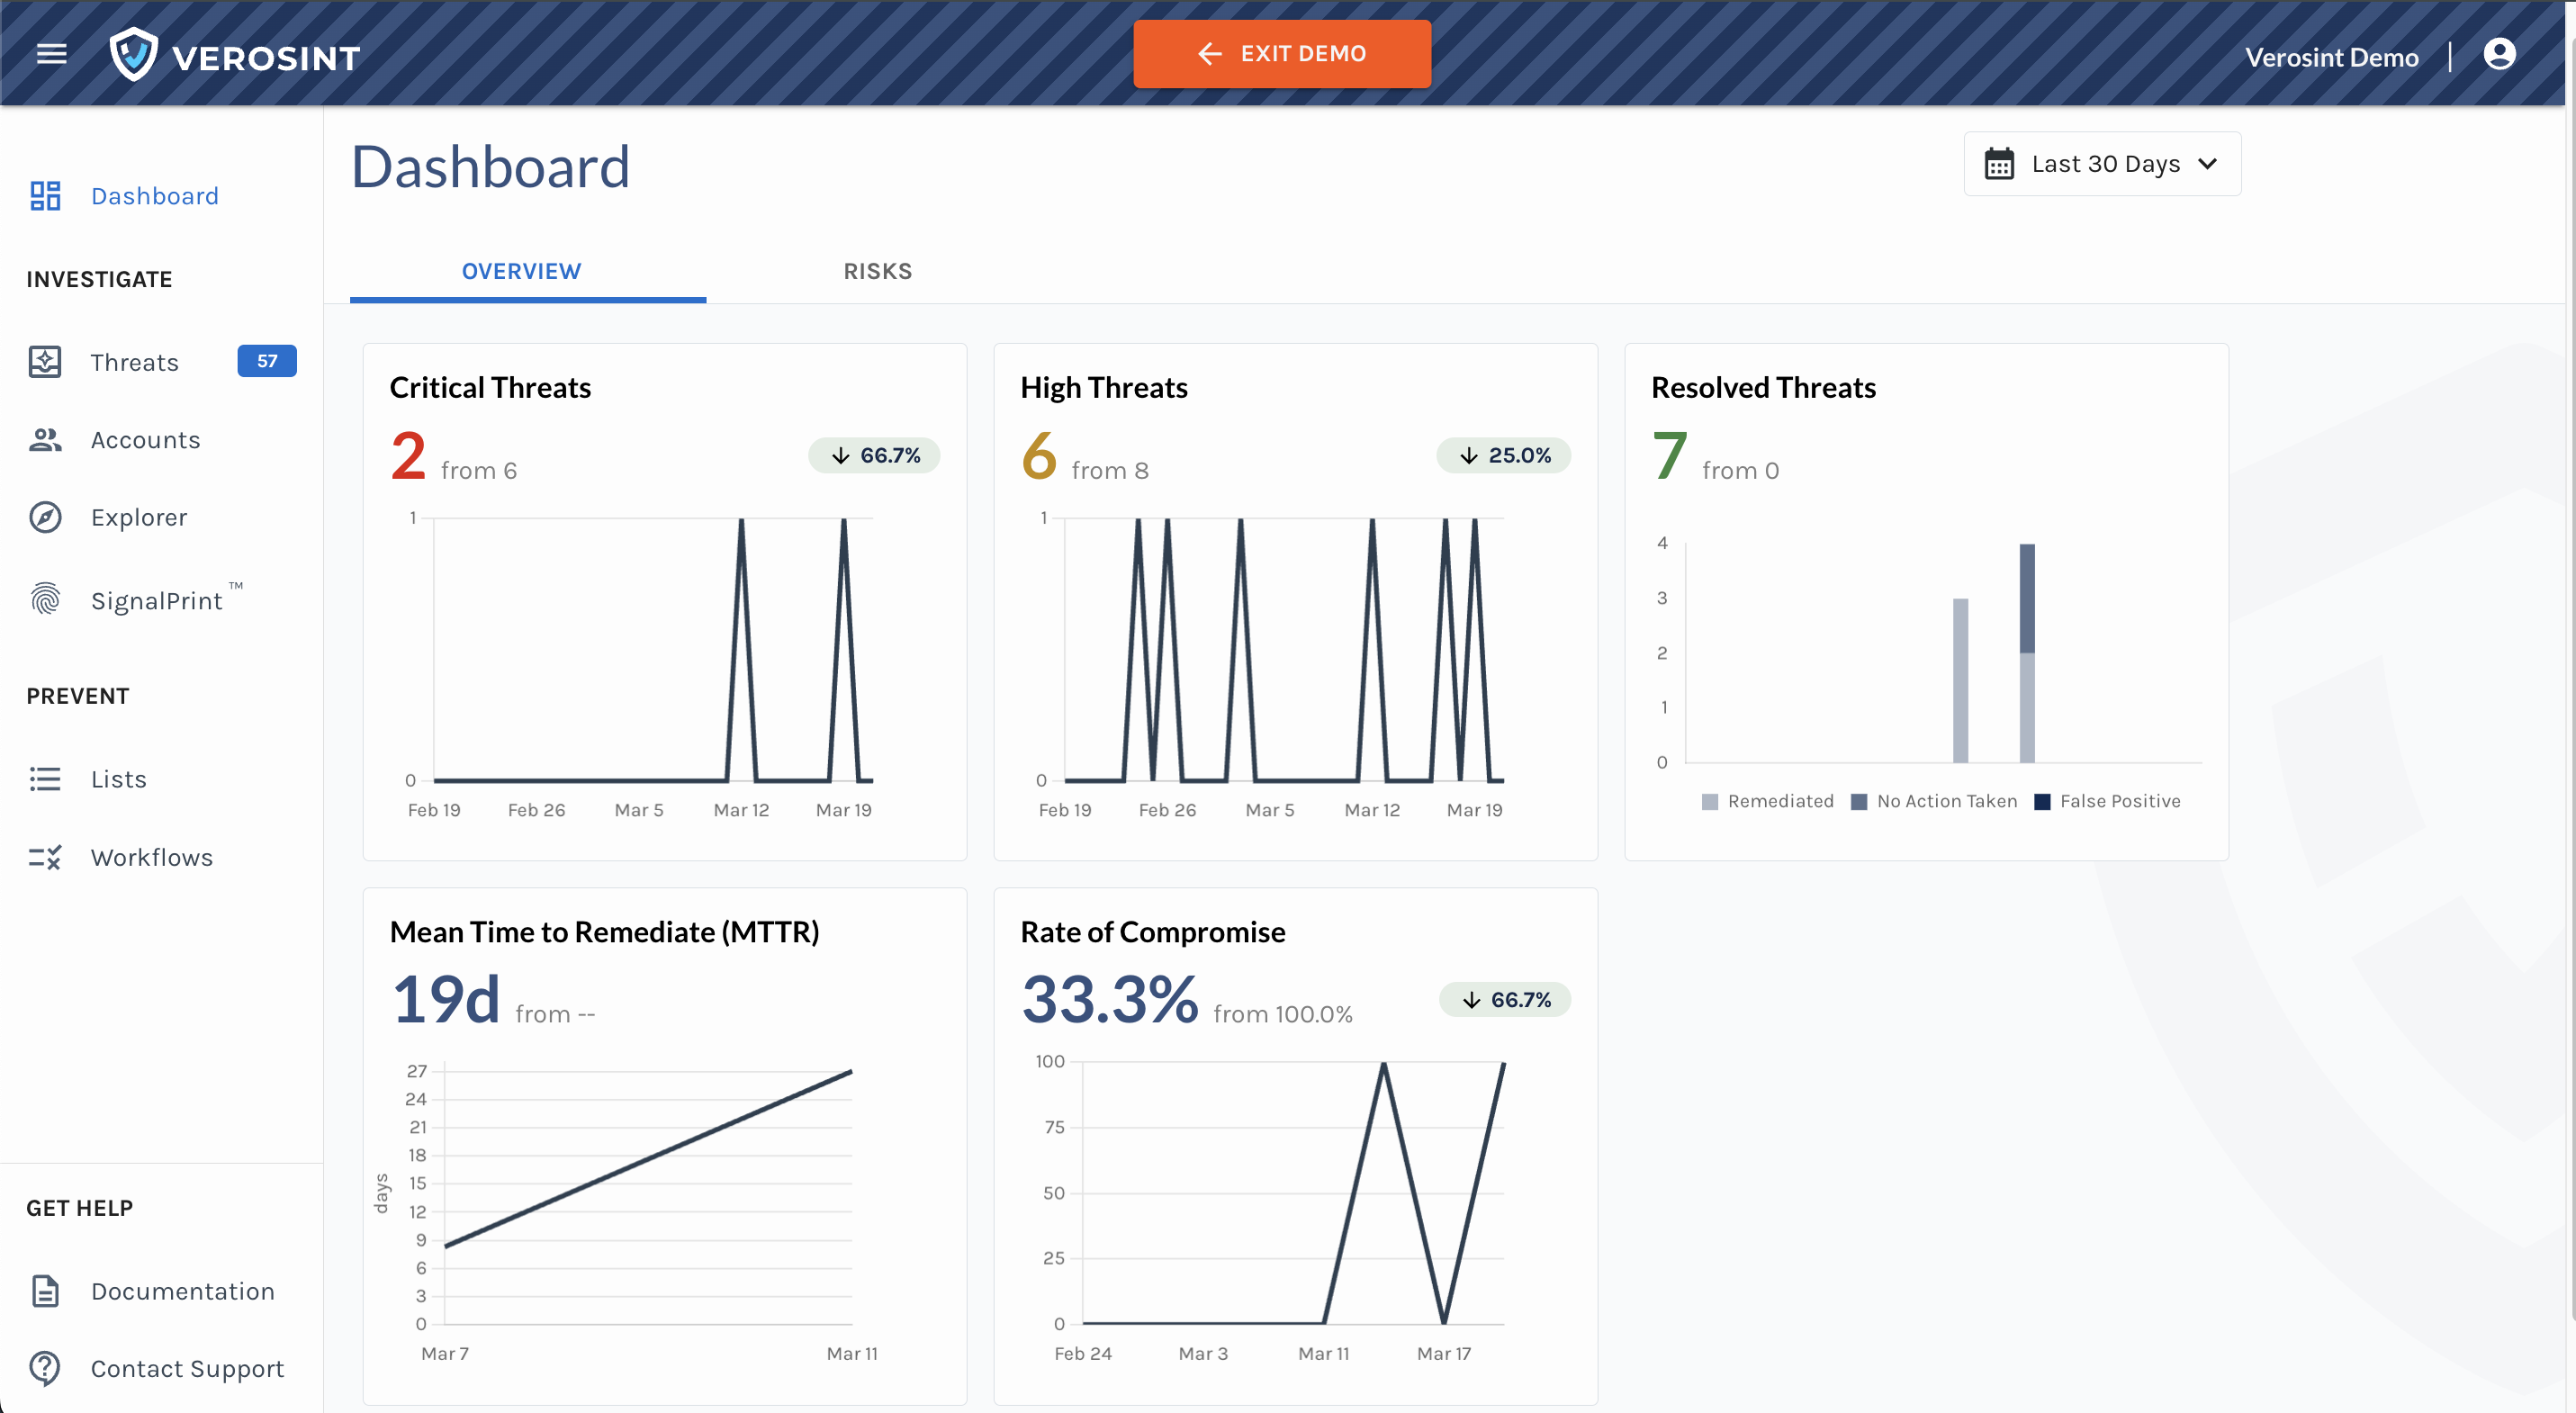
Dashboard - Overview tab
Risks
The Risks tab provides a glanceable view of key risk insights across your workspace.
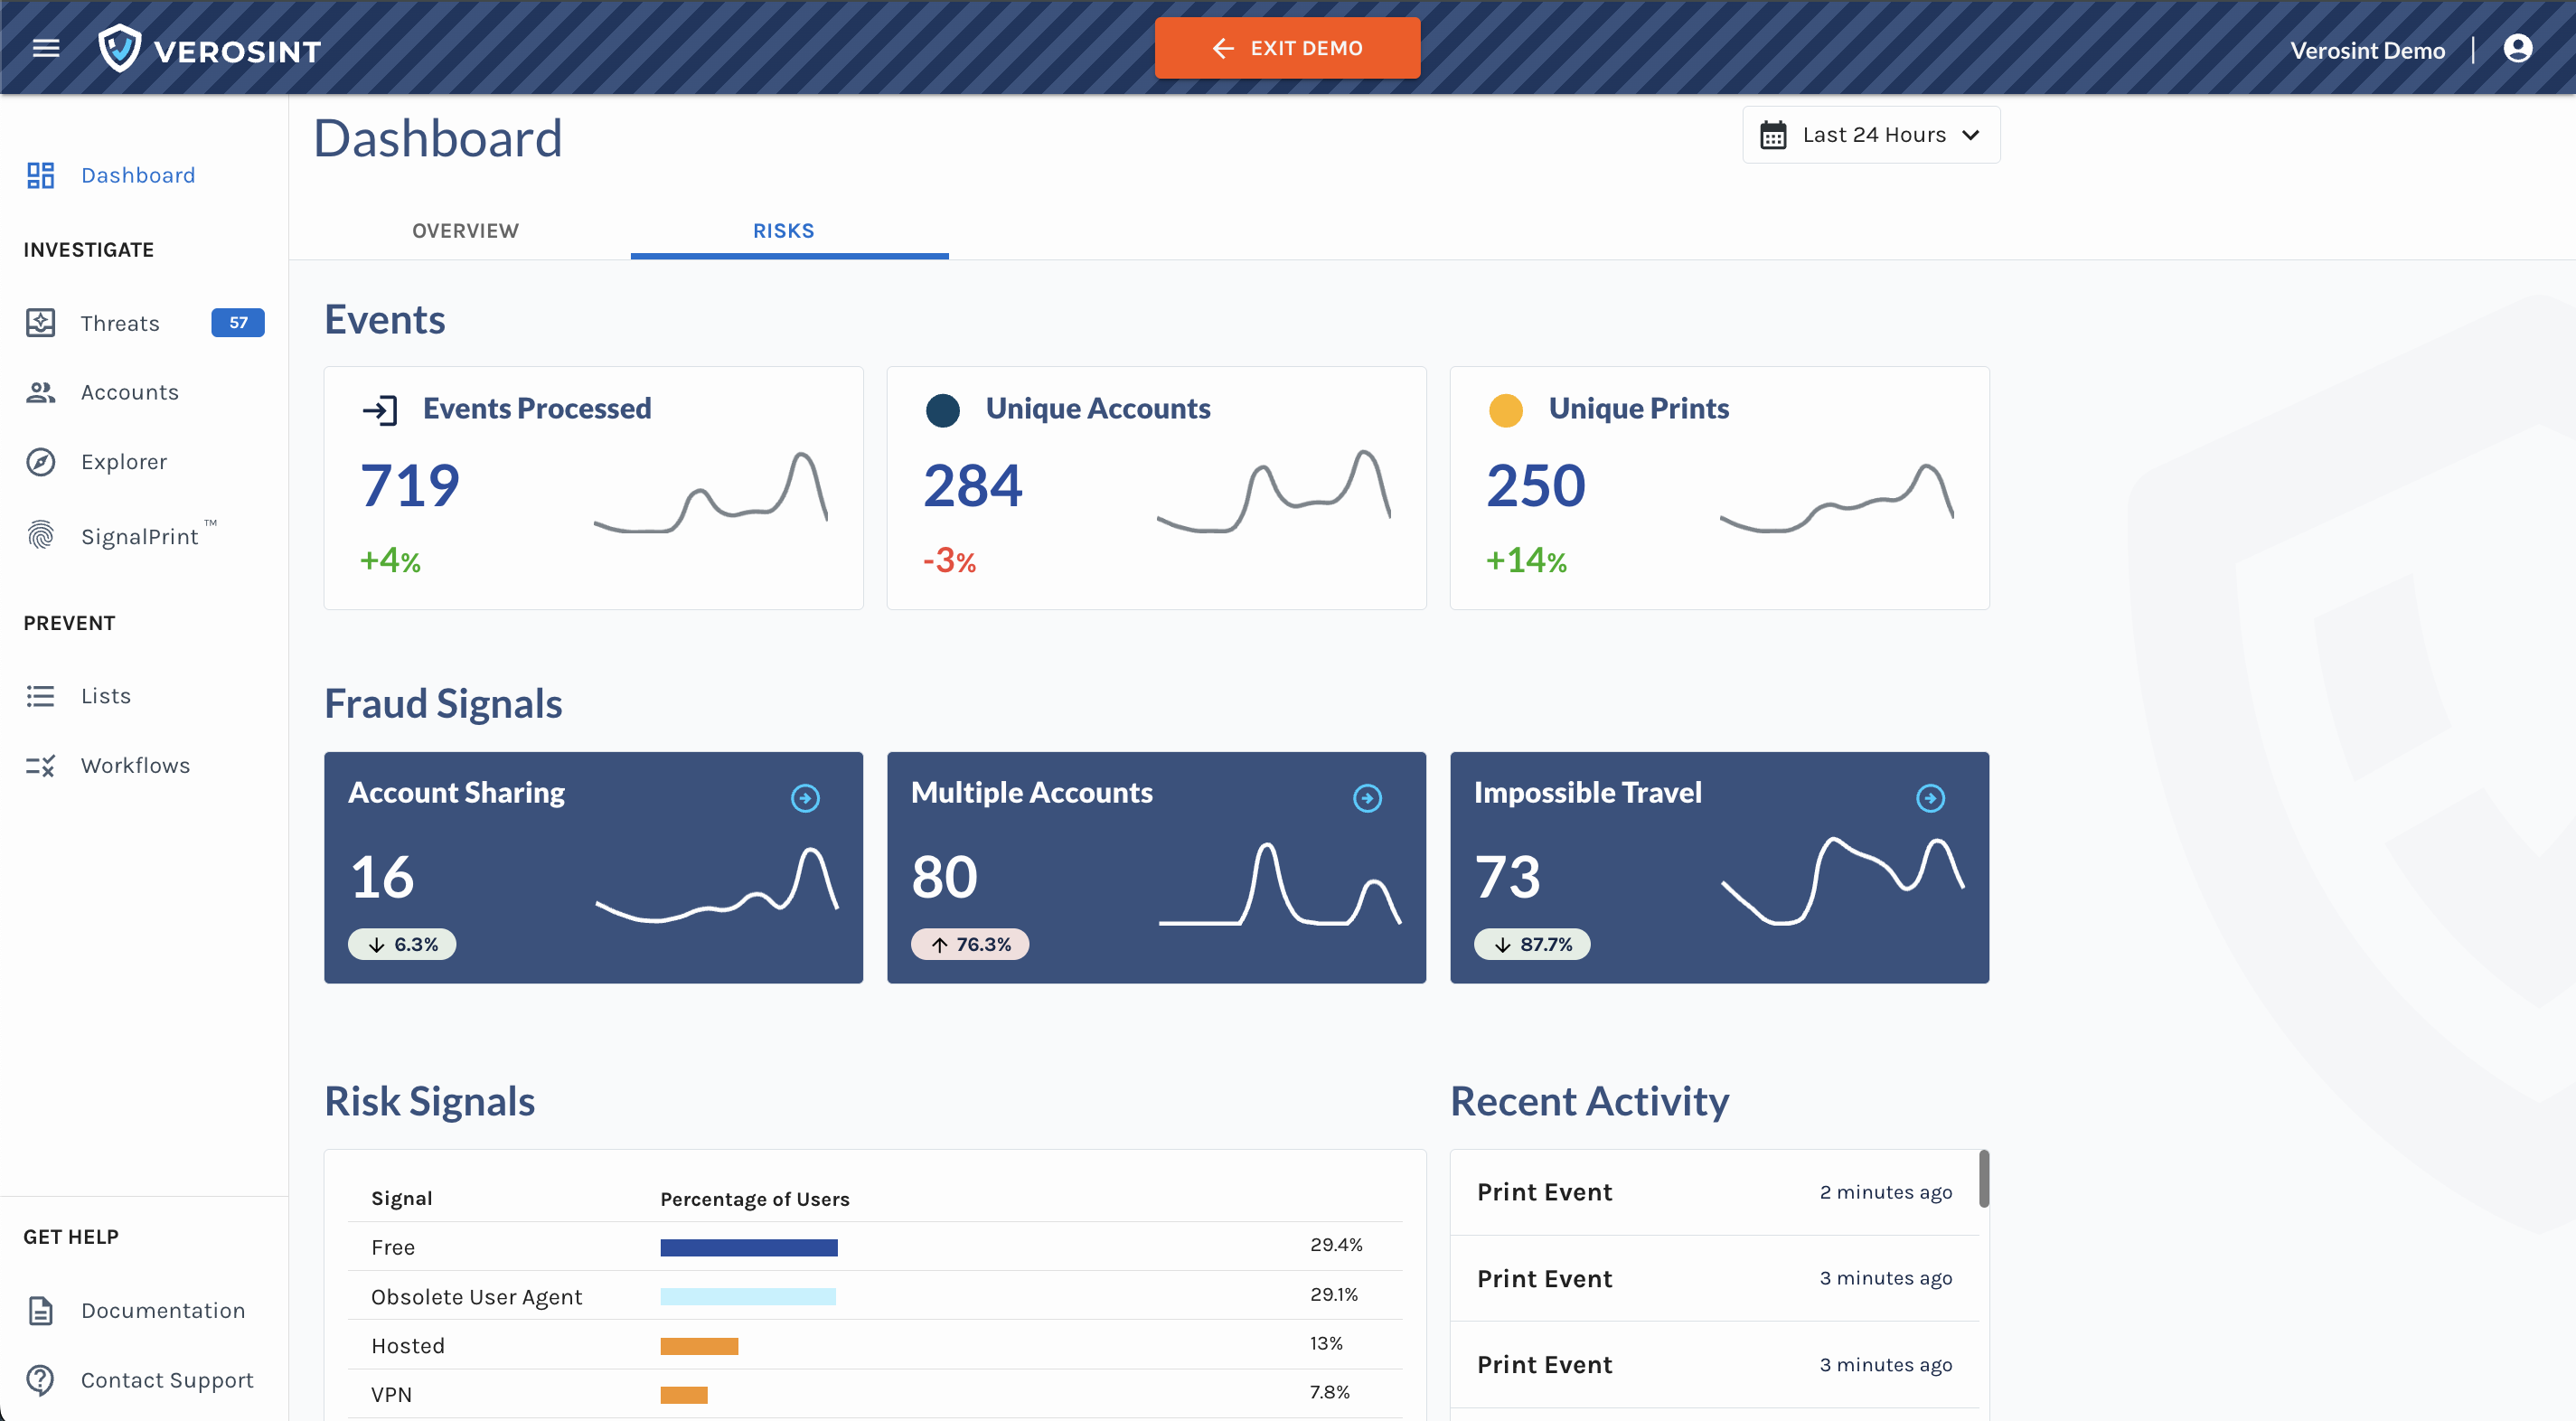
Dashboard - Risks
Updated 10 months ago